
Autor: Jarosław Jamka
My key takeaways:
1) Total revenue increased in Q2 2024 (Q4 2024 on fiscal basis) by 15.2% YoY to $64.73 billion (slightly beating expectations of $64.52 billion). The average YoY growth for the last 6 years is 14.48%. Overall, it is “a growth company”… with a company of this size, it is not that easy to increase revenues from $30 billion per quarter to $65 billion per quarter in 6 years. See Figure 1.

2) Microsoft divides revenues into 3 segments:
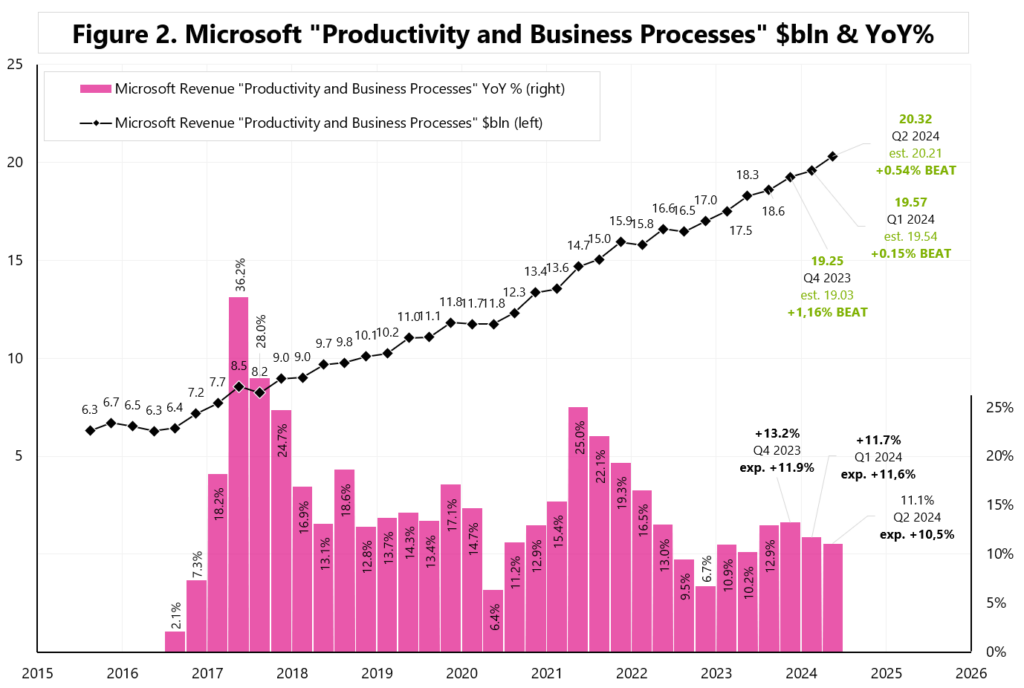
– First, Productivity and Business Processes (e.g. Office and LinkedIn are here)
$20.23 billion (+0.54% beat, +11.1% YoY – Figure 2),
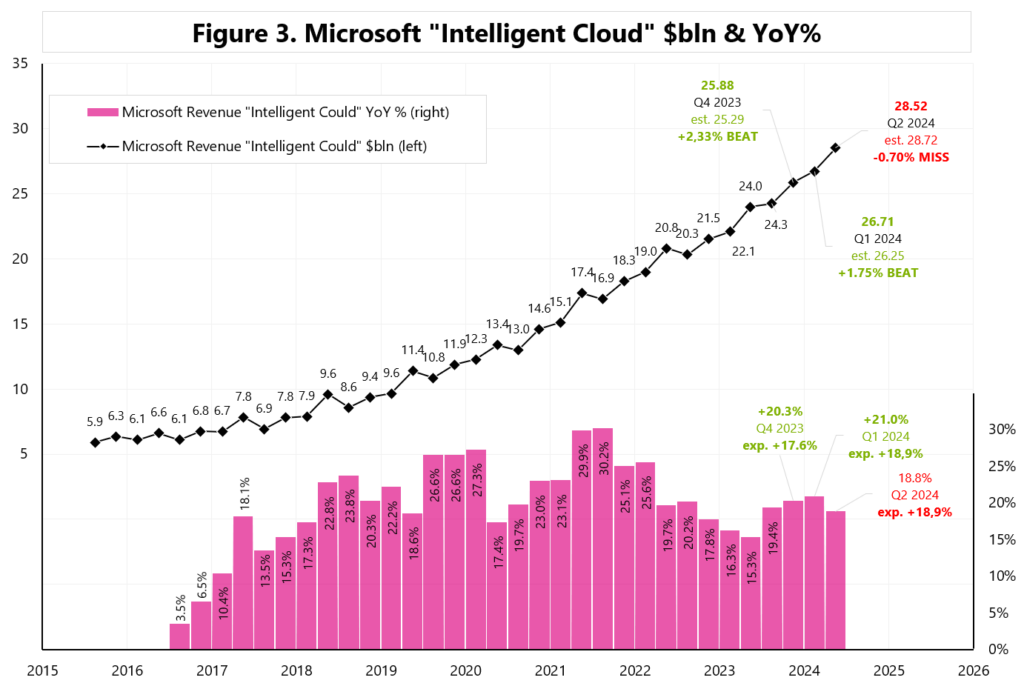
– Second, Intelligent Cloud (e.g. Azur, Server Products)
$28.52 billion (-0.75% sales miss, +18.8% YoY – Figure 3,
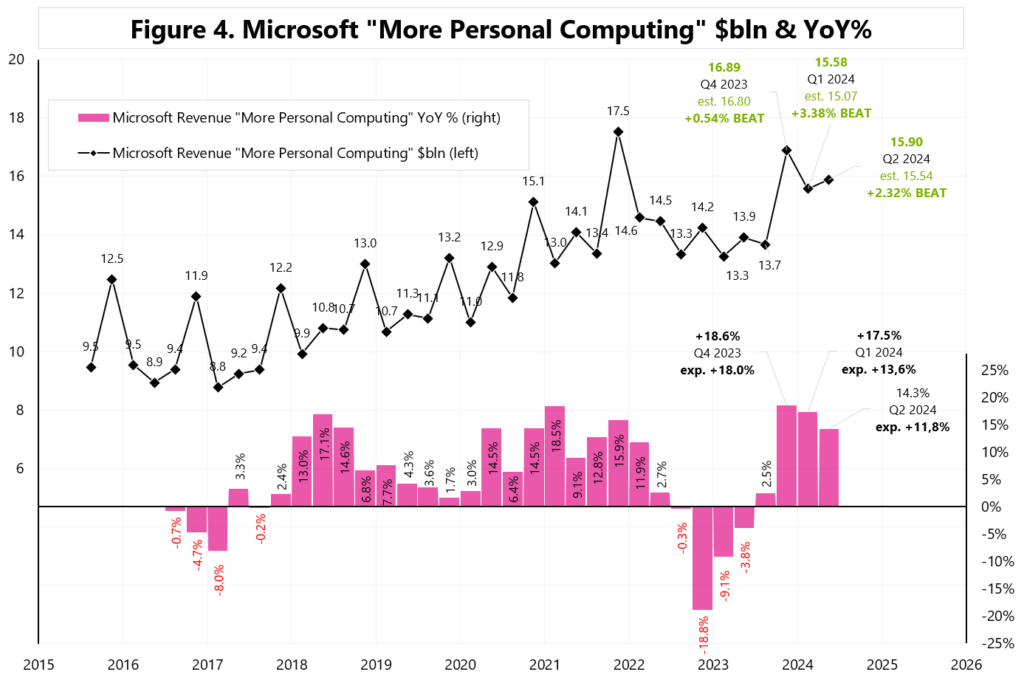
– Third, More Personal Computing (e.g. Windows, Gaming, Search)
$15.90 billion (+2.32% sales beat, +14.3% YoY – Figure 4).
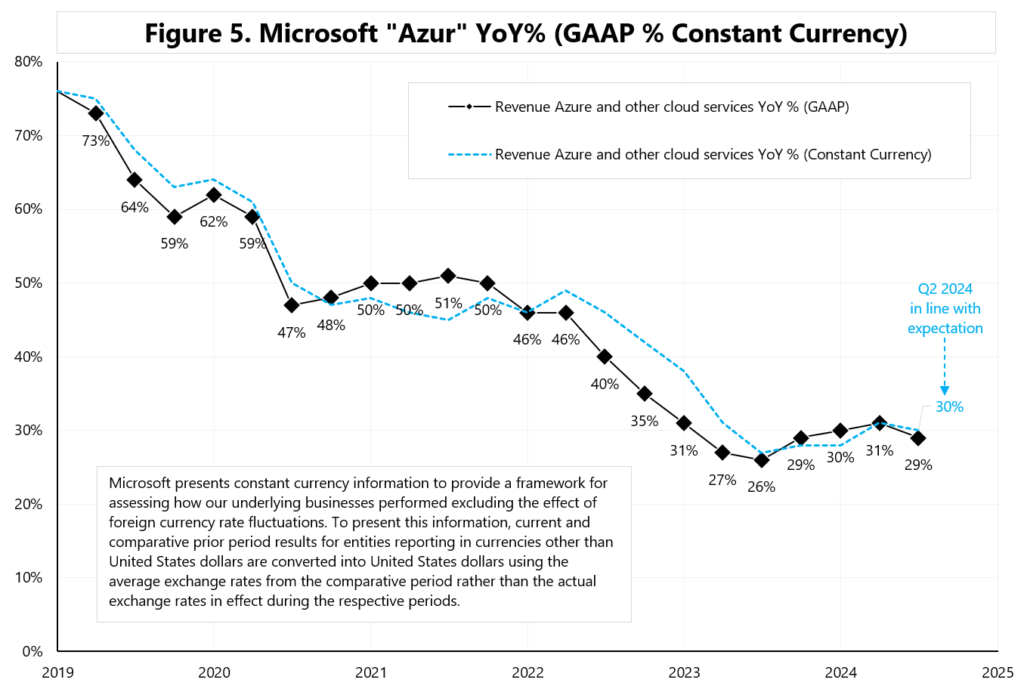
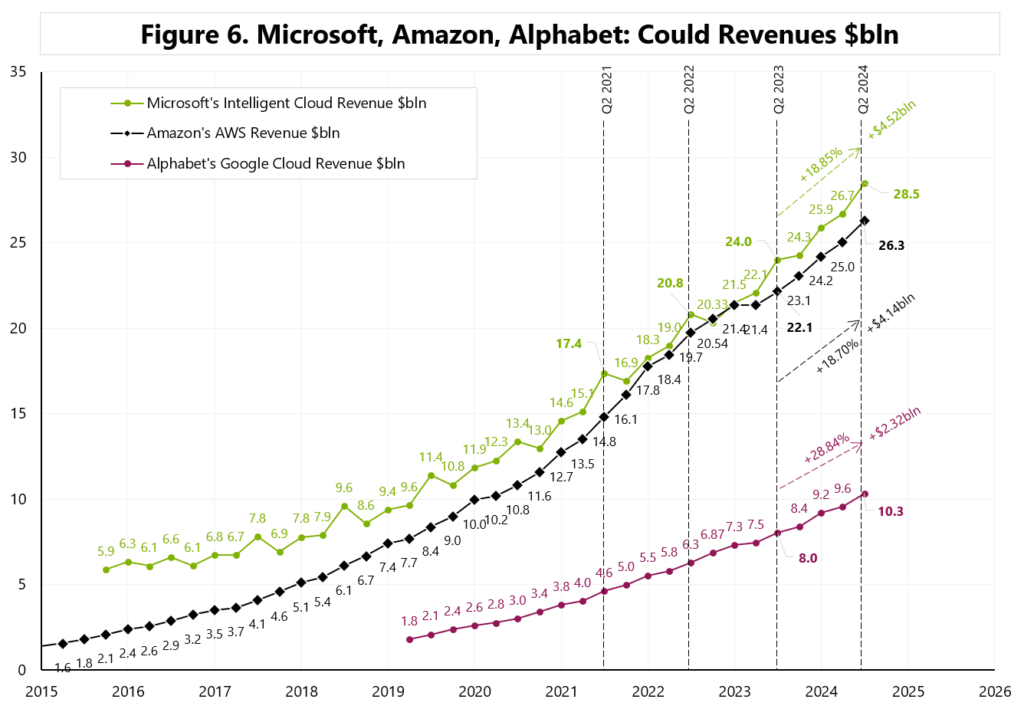
3) Azur is still a big success story. Revenues grew +29% YoY (GAAP) and +30% (constant currency, in line with expectations). Figure 5. „Azur and other cloud services” is part of the Intelligent Cloud segment, which, compared to the competition, is both the largest and the fastest growing (on a $ basis) – see Figure 6.
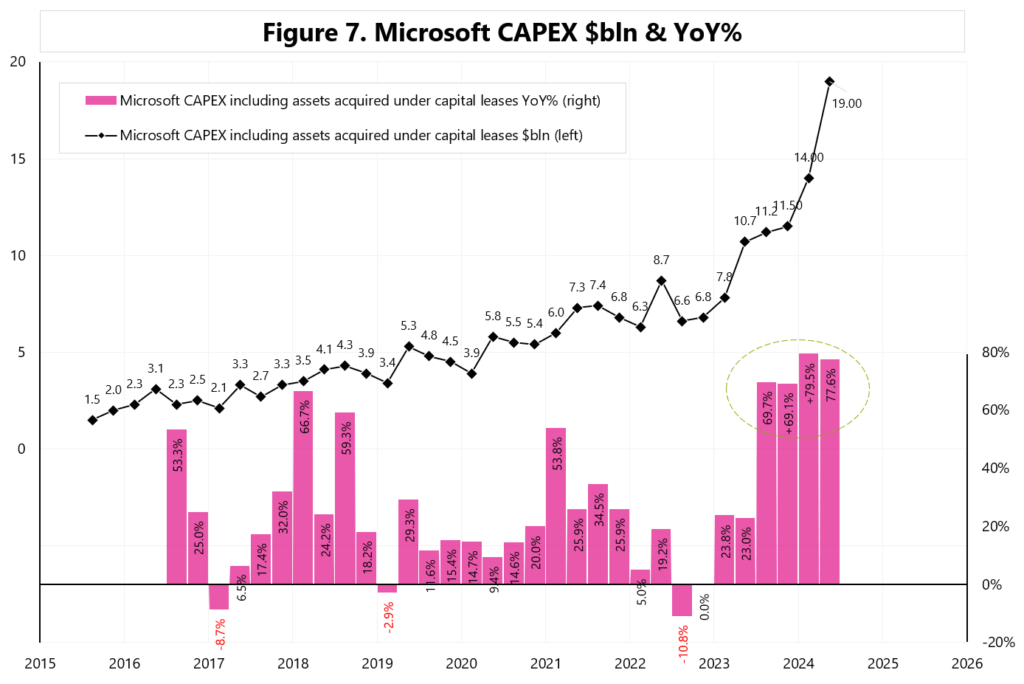
4) (AI-related) Capex is still growing at a rate of approximately 80% YoY, in Q2 2024 (Q4 2024 fiscal) it amounted to $19.0 bln. See Figure 7.
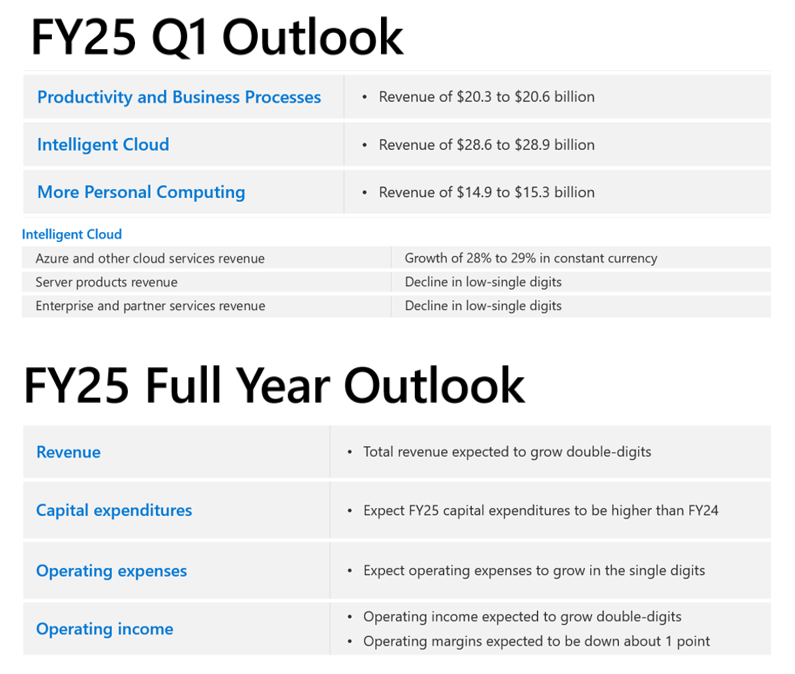
5) Solid outlook, see Table 1.
SATYA NADELLA, CEO, on Azur:
“We expanded our datacenter footprint, announcing investments across four continents. These are long term assets around the world to drive growth for the next decade and beyond. We added new AI accelerators from AMD and NVIDIA, as well as our own first party silicon Azure Maia.
(…) We continued to see sustained revenue growth from migrations. Azure Arc is helping customers in every industry, from ABB and Cathay Pacific, to LALIGA, to streamline their cloud migrations. We now have 36,000 Arc customers, up 90% year-over-year. We remain the hyperscale cloud of choice for SAP and Oracle workloads. (…) With Azure AI, we are building out the app server for the AI wave, providing access to the most diverse selection of models to meet customers’ unique cost, latency, and design considerations. All-up, we now have over 60,000 Azure AI customers, up nearly 60% year-over-year, and average spend per customer continues to grow. Azure OpenAI Service provides access to best-in-class frontier models, including as of this quarter GPT-4o and GPT-4o mini. With Phi-3, we offer a family of powerful, small language models, which are being used by companies like BlackRock, Emirates, Epic, ITC, Navy Federal Credit Union, and others. And with Models as a Service, we provide API access to third party models, including as of last week the latest from Cohere, Meta, and Mistral. The number of paid Models as a Service customers more than doubled quarter-over-quarter (…)”.
AMY HOOD, CFO on Azur and AI services demand:
“Azure and other cloud services revenue grew 29% and 30% in constant currency, in line with expectations and consistent with Q3 when adjusting for leap year. Azure growth included 8 points from AI services where demand remained higher than our available capacity. In June, we saw slightly lower-than-expected growth in a few European geos”.
AMY HOOD on CAPEX:
“Capital expenditures including finance leases were $19 billion, in line with expectations, and cash paid for P, P, and E was $13.9 billion. Cloud and AI related spend represents nearly all of total capital expenditures. Within that, roughly half is for infrastructure needs where we continue to build and lease datacenters that will support monetization over the next 15 years and beyond. The remaining cloud and AI related spend is primarily for servers, both CPUs and GPUs, to serve customers based on demand signals. For the full fiscal year, the mix of our cloud and AI related spend was similar to Q4”.
AMY HOOD on CAPEX outlook:
“To meet the growing demand signal for our AI and cloud products, we will scale our infrastructure investments with FY25 capital expenditures expected to be higher than FY24. As a reminder, these expenditures are dependent on demand signals and adoption of our services that will be managed thru the year”.

Niniejszy materiał jest informacją reklamową. Ma charakter edukacyjno-informacyjny i stanowi wyraz własnych ocen, przemyśleń i opinii autora. Niniejszy materiał służy jedynie celom informacyjnym i nie stanowi oferty, w tym oferty w rozumieniu art. 66 oraz zaproszenia do zawarcia umowy w rozumieniu art. 71 ustawy z dnia 23 kwietnia 1964 r. – Kodeks cywilny (t.j. Dz. U. z 2020 r. poz. 1740, 2320), ani oferty publicznej w rozumieniu art. 3 ustawy z dnia 29 lipca 2005 r. o ofercie publicznej i warunkach wprowadzania instrumentów finansowych do zorganizowanego systemu obrotu oraz o spółkach publicznych (t.j. Dz. U. z 2022 r. poz. 2554, z 2023 r. poz. 825, 1723) czy też oferty publicznej w rozumieniu art 2 lit d) Rozporządzenia Parlamentu Europejskiego i Rady (UE) 2017/1129 z dnia 14 czerwca 2017 r. w sprawie prospektu, który ma być publikowany w związku z ofertą publiczną papierów wartościowych lub dopuszczeniem ich do obrotu na rynku regulowanym oraz uchylenia dyrektywy 2003/71/WE (Dz. Urz. UE L 168 z 30.06.2017, str. 12); Niniejszy materiał nie stanowi także rekomendacji, zaproszenia, ani usług doradztwa. prawnego, podatkowego, finansowego lub inwestycyjnego, związanego z inwestowaniem w jakiekolwiek papiery wartościowe. Materiał ten nie może stanowić podstawy do podjęcia decyzji o dokonaniu jakiejkolwiek inwestycji w papiery wartościowe czy instrumenty finansowe. Informacje zamieszczone w materiale nie stanowią rekomendacji w rozumieniu przepisów Rozporządzenia Parlamentu Europejskiego i Rady (UE) NR 596/2014 z dnia 16 kwietnia 2014 r. w sprawie nadużyć na rynku (rozporządzenie w sprawie nadużyć na rynku) oraz uchylające dyrektywę 2003/6/ WE Parlamentu Europejskiego i Rady i dyrektywy Komisji 2003/124/WE, 2003/125/WE i 2004/72/ WE. (Dz. U UE L 173/1 z dnia 12.06.20114). NDM S.A., nie ponosi odpowiedzialności za prawdziwość, rzetelność i kompletność oraz aktualność danych i informacji zamieszczonych w niniejszej prezentacji. NDM S.A. nie ponosi również jakiejkolwiek odpowiedzialności za szkody wynikające z wykorzystania niniejszego materiału, informacji i danych w nim zawartych. Zawartość materiału została przygotowana na podstawie opracowań sporządzonych zgodnie z najlepszą wiedzą NDM S.A. oraz przy wykorzystaniu informacji i danych publicznie dostępnych, chyba, że wyraźnie wskazano inne źródło pochodzenia danych.