Autor: Jarosław Jamka
Meta reported quite solid results, however all that has been already priced in as the stock price have increased by 24.6% since the previous earnings release (S&P500 +5.3% over the same period).
My key takeaways:
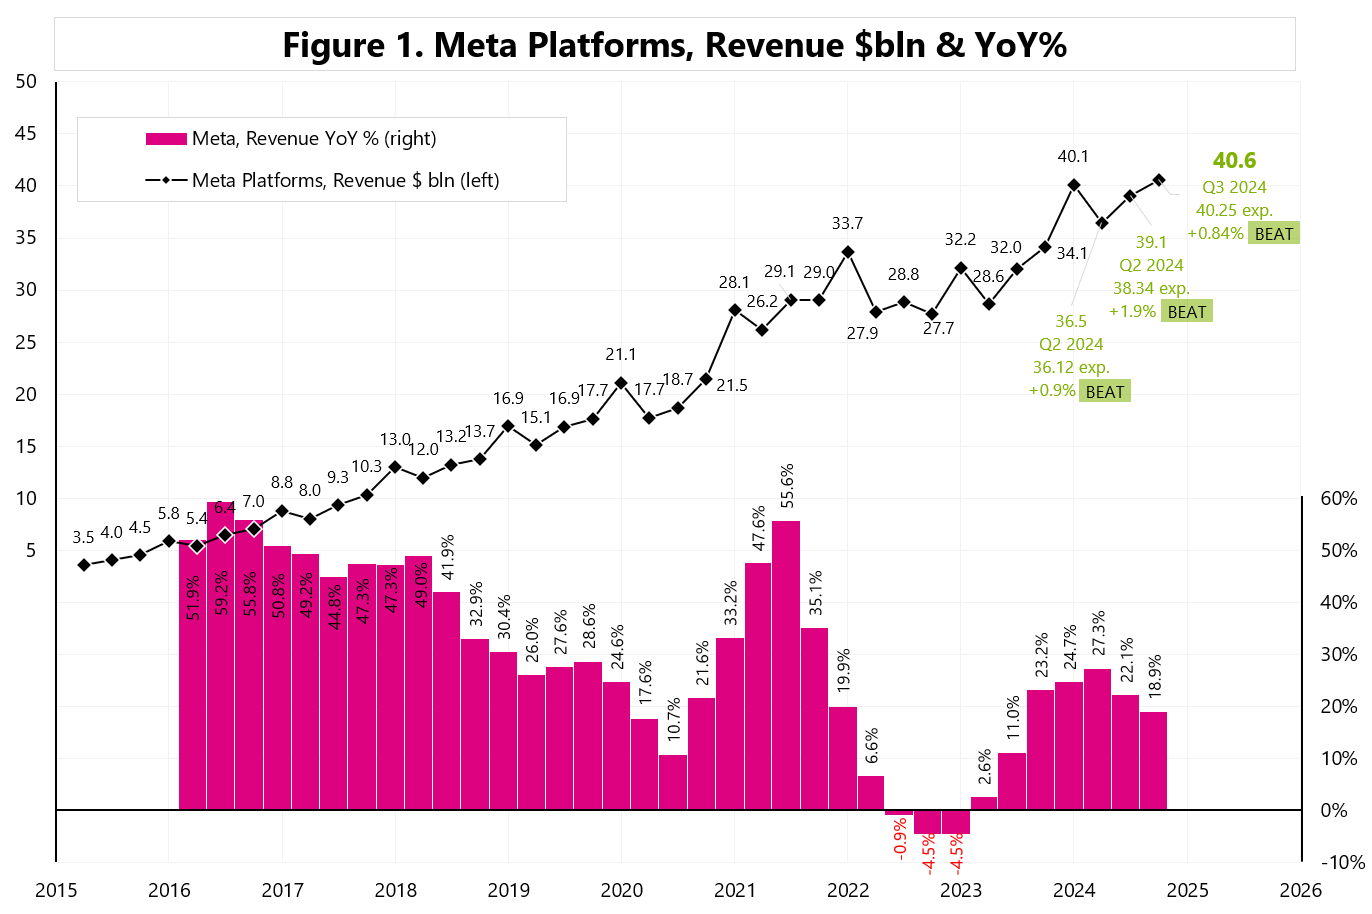
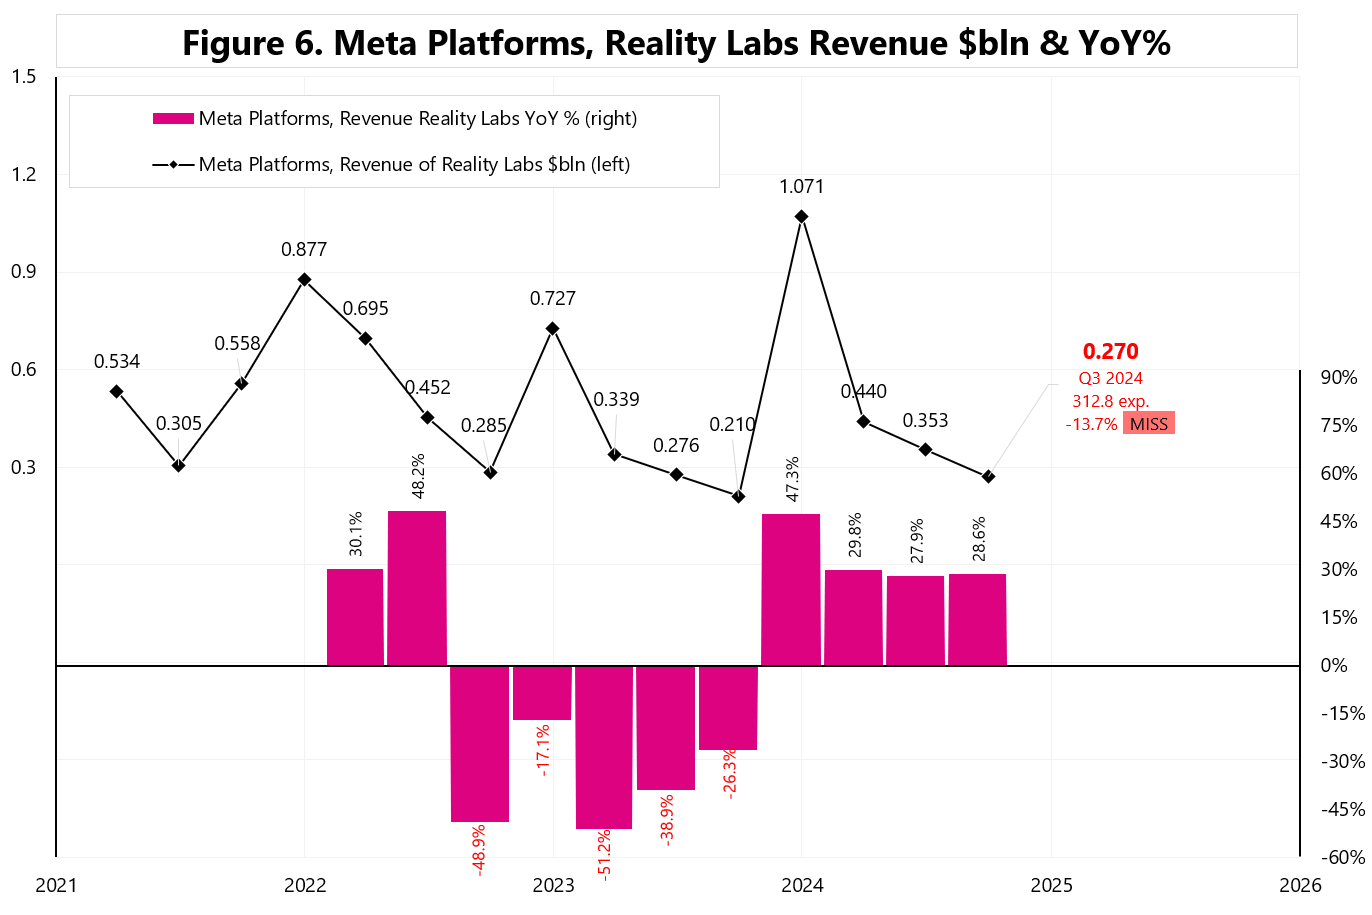
1) Meta beat revenue growth expectations in Q3 2024 on almost all lines (except Reality Labs, which is not significant because it only accounts for 0.7% of total revenue). Total Revenue grew by 18.9% YoY in Q3 – see Figure 1.
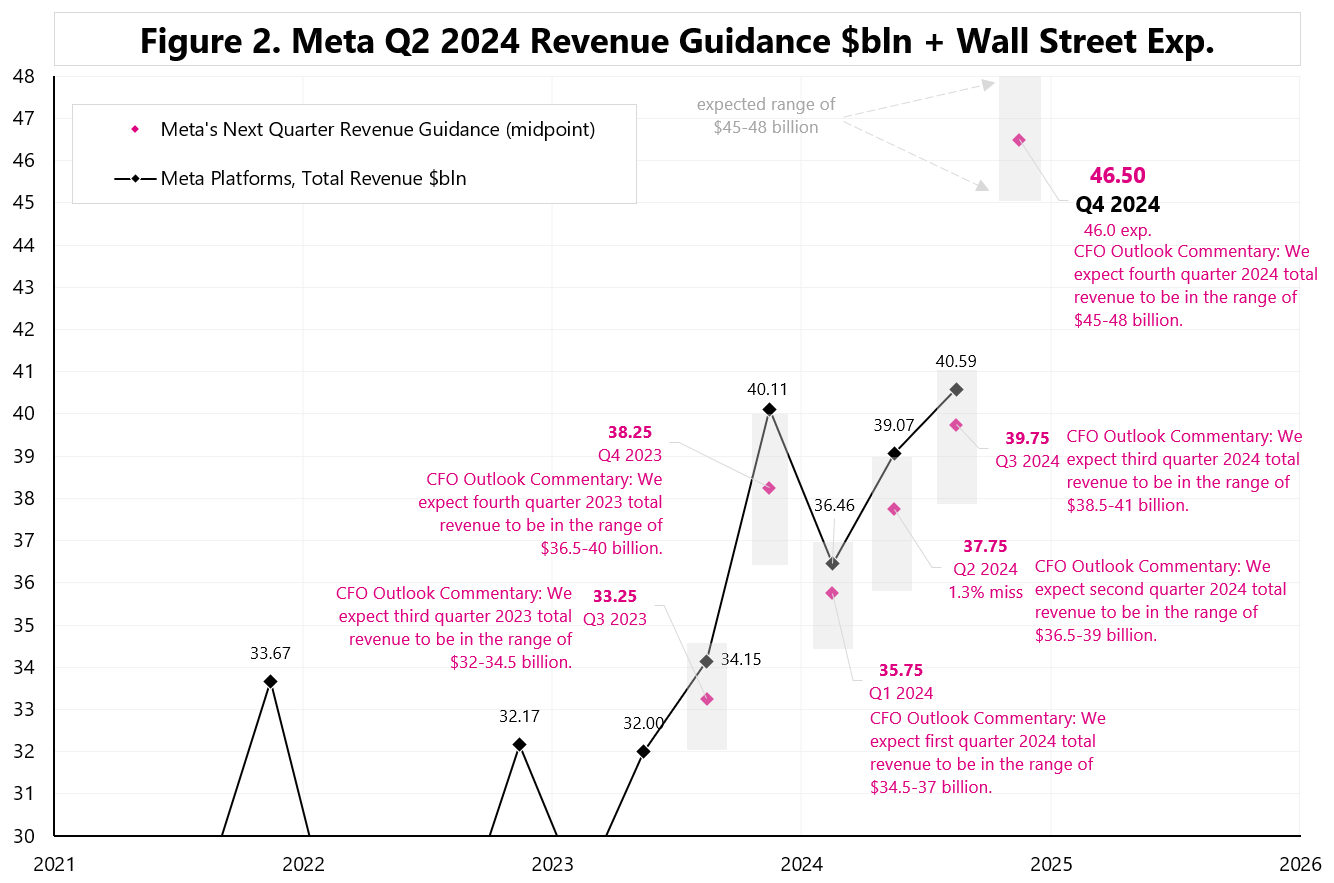
2) Meta has no intention of slowing down in Q4 2024 – it has given a revenue growth guidance for Q4 above Wall Street expectations. In Q4, Meta expects revenue in the range of $45-48 billion, and looking at the history of beating its own forecasts (Figure 2), the upper range of the forecast ($48 billion) means YoY growth of as much as 19.7%! This is impressive for a company of this size…
3) Meta intends to continue to invest aggressively, Susan Li, CFO:
“We anticipate our full year 2024 capital expenditures will be in the range of $38-40 billion, updated from our prior range of $37-40 billion. We continue to expect significant capital expenditures growth in 2025. Given this, along with the back-end weighted nature of our 2024 capex, we expect a significant acceleration in infrastructure expense growth next year as we recognize higher growth in depreciation and operating expenses of our expanded infrastructure fleet”.
Mark Zuckerberg on Meta’s AI models:
“The Llama 3 models have been something of an inflection point in the industry, but I’m even more excited about Llama 4, which is now well into its development. We’re training the Llama 4 models on a cluster that is bigger than 100k H100s or bigger than anything that I’ve seen reported for what others are doing. I expect that the smaller Llama 4 models will be ready first, and they’ll be ready, we expect sometime early next year, and I think that they’re going to be a big deal on several fronts — new modalities, capabilities, stronger reasoning, and much faster”.
All in all: solid results, solid growth outlook, increased CAPEX and wide AI adoption and ongoing intense AI-related investments.
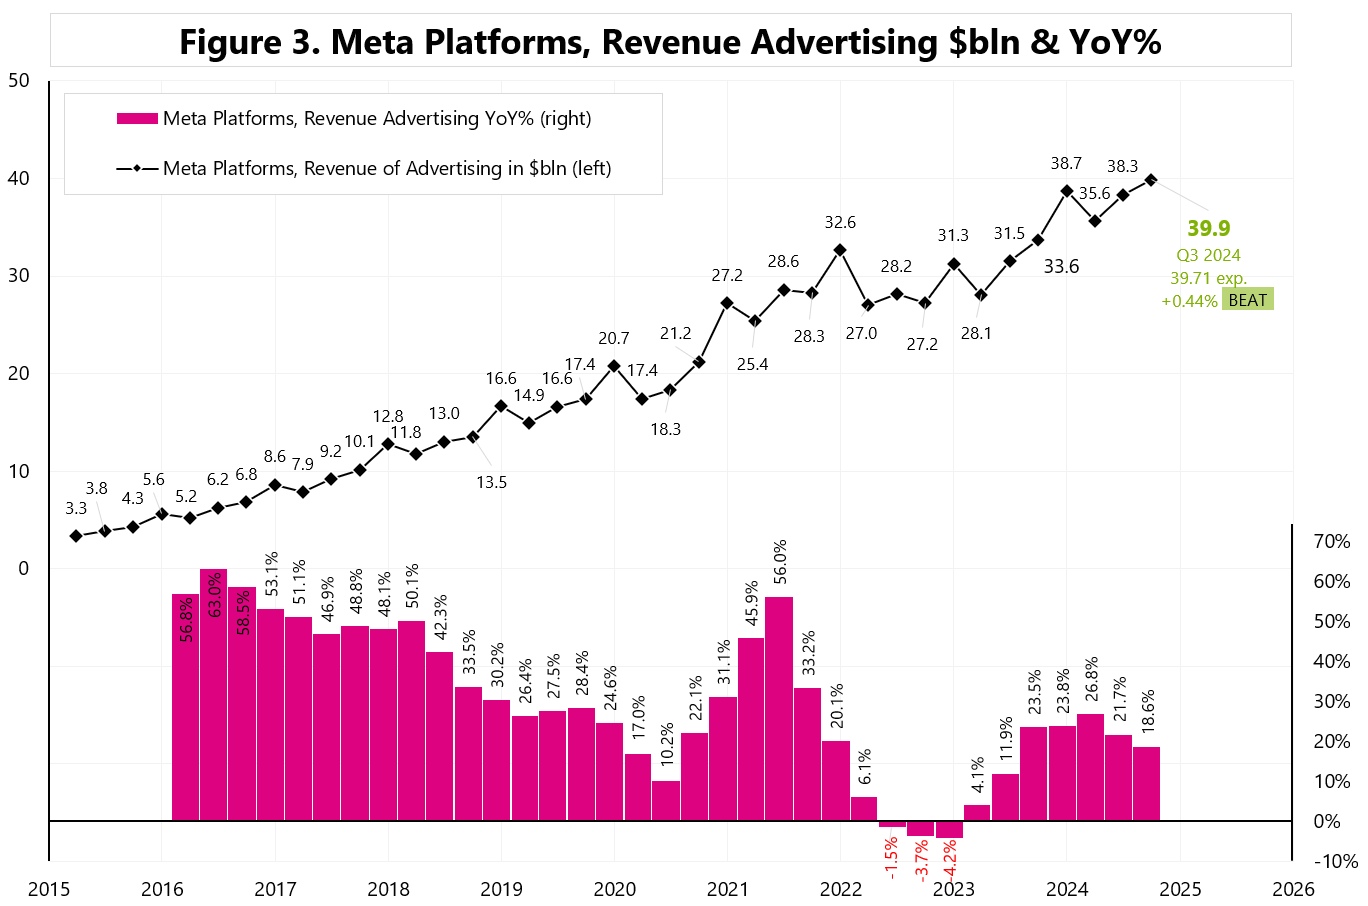
Figure 3 shows Advertising segment revenues.
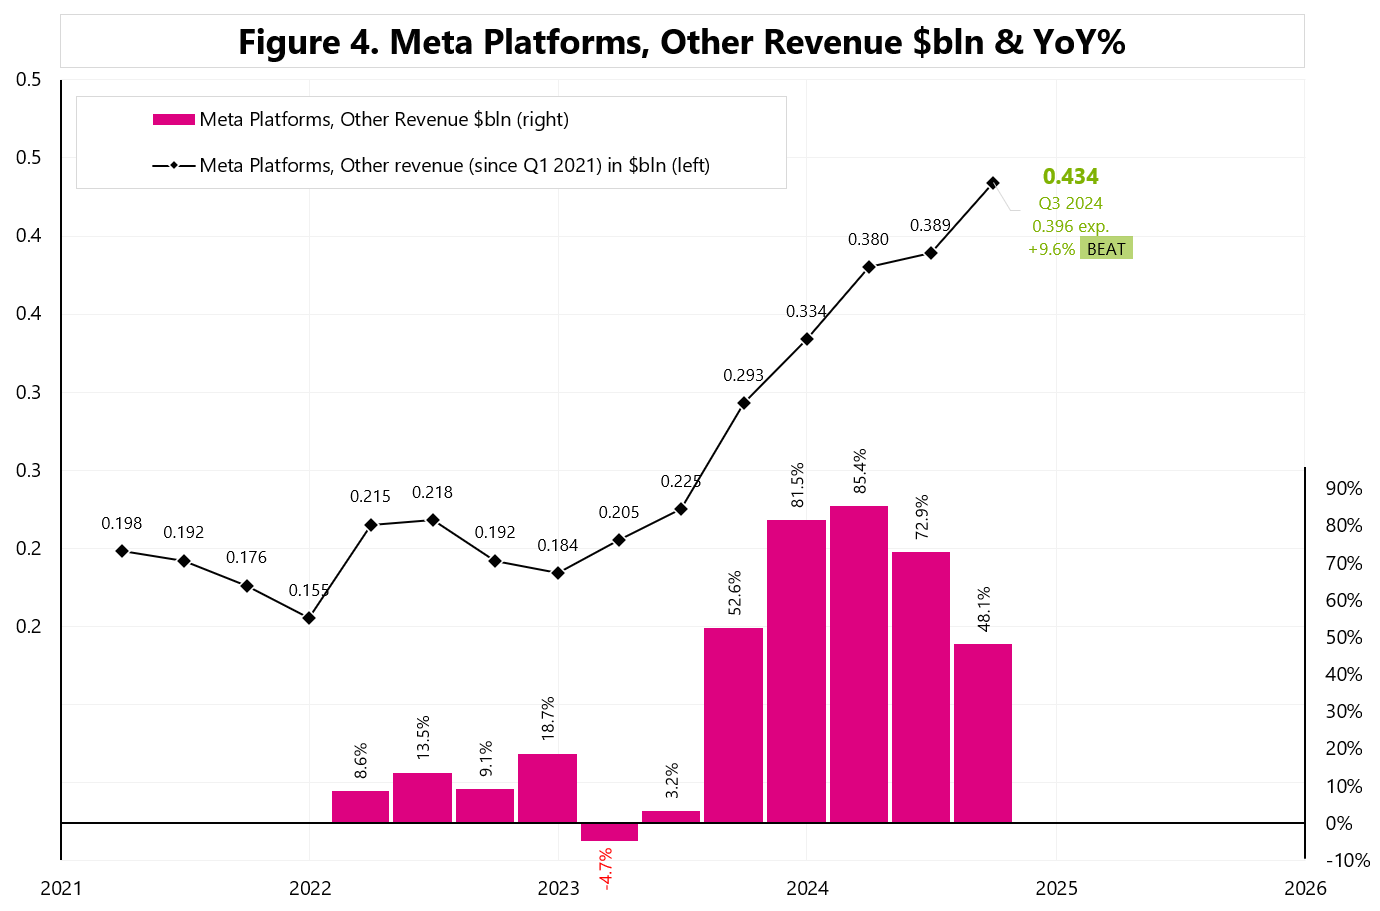
Figure 4 shows Other Revenue segment revenues.
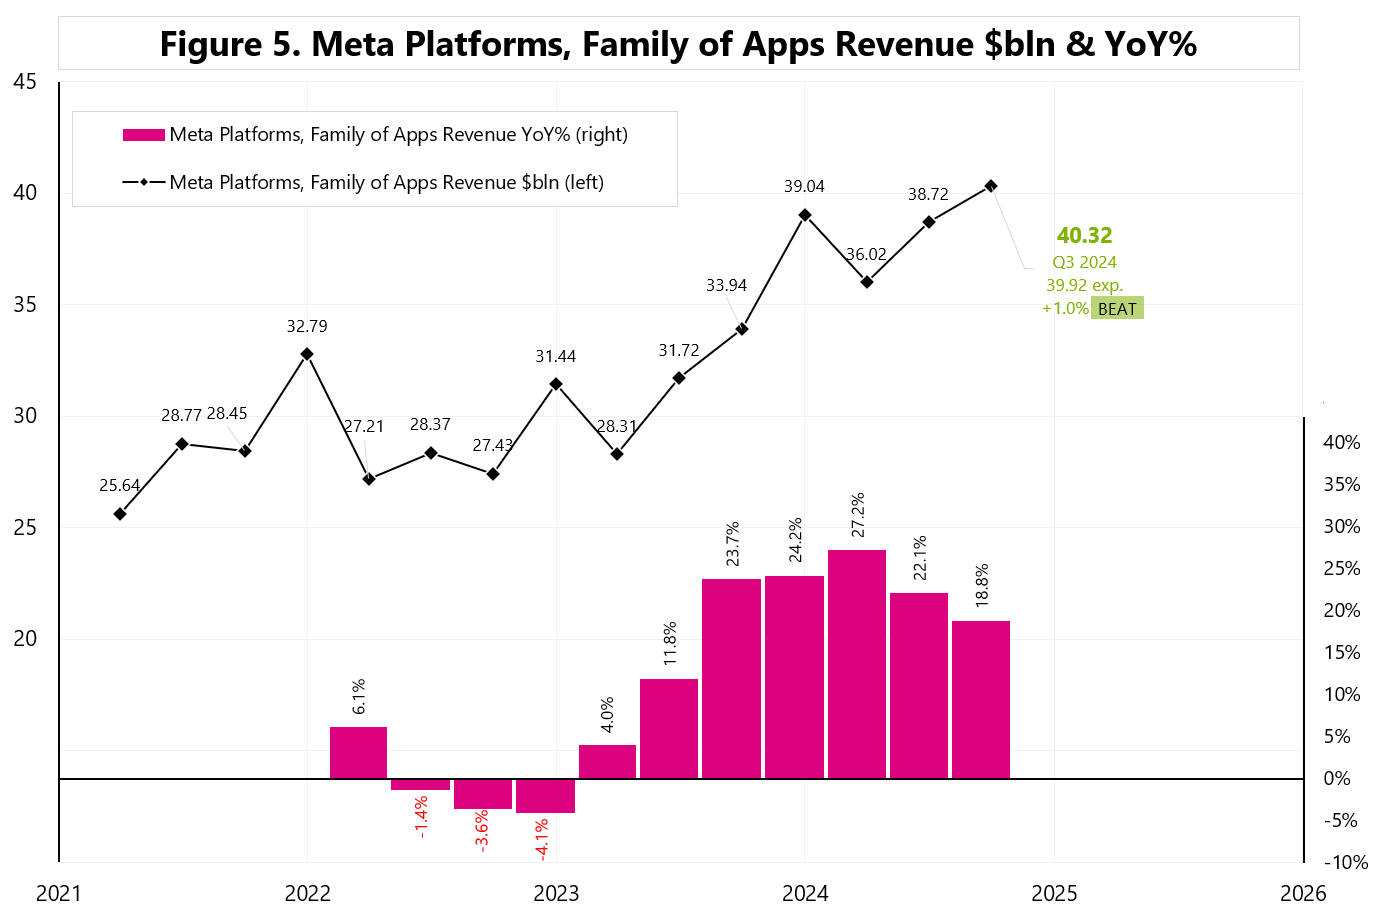
Figure 5 shows Family of Apps segment revenues (Advertising + Other Revenue).
Total Revenue: Family of Apps + Reality Labs (Figure 1).
Figure 6 shows Reality Labs segment revenues.
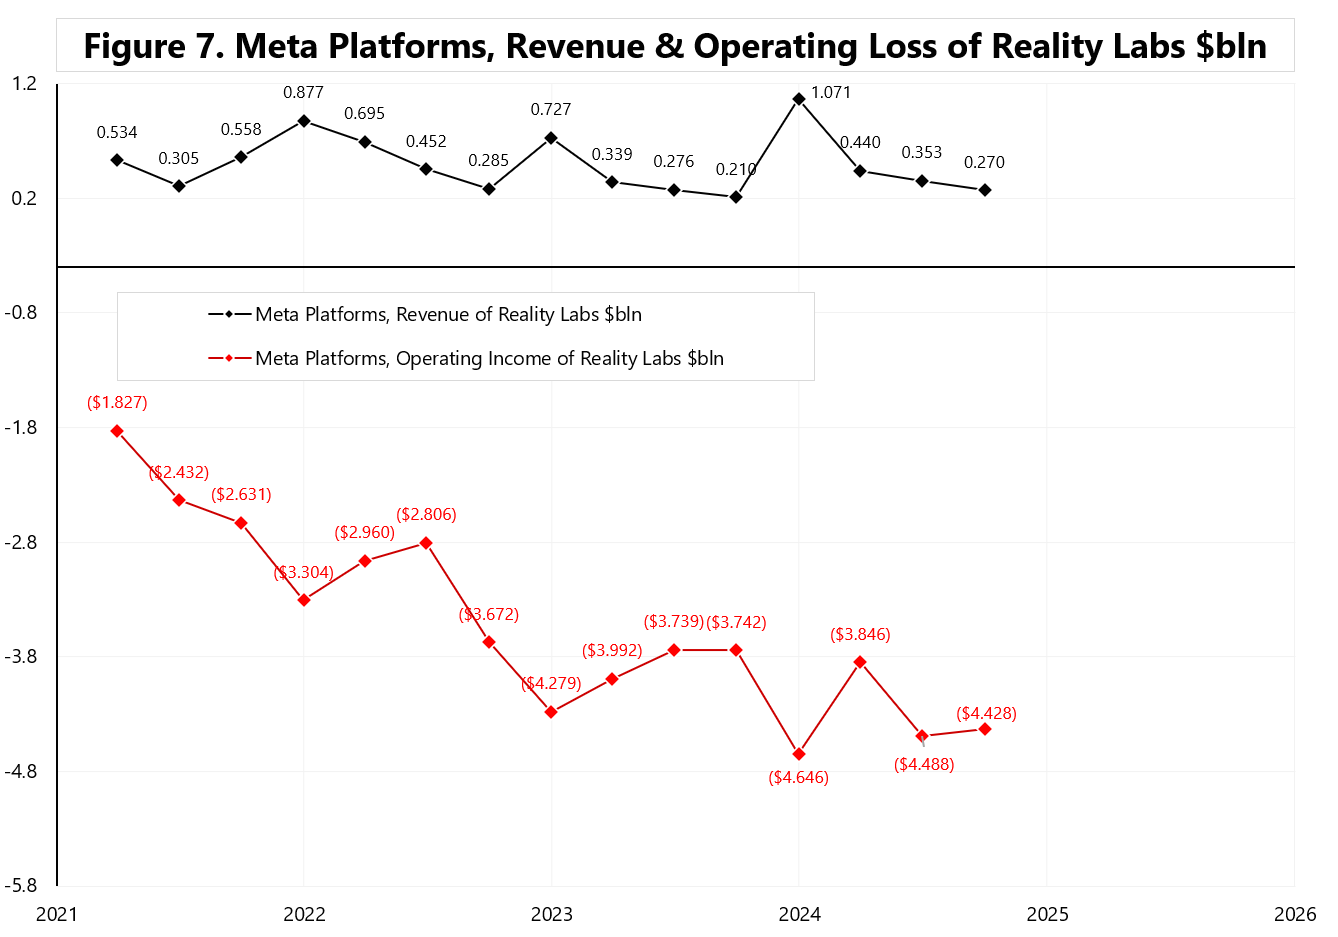
Figure 7 shows Reality Labs segment revenues and operating loss.
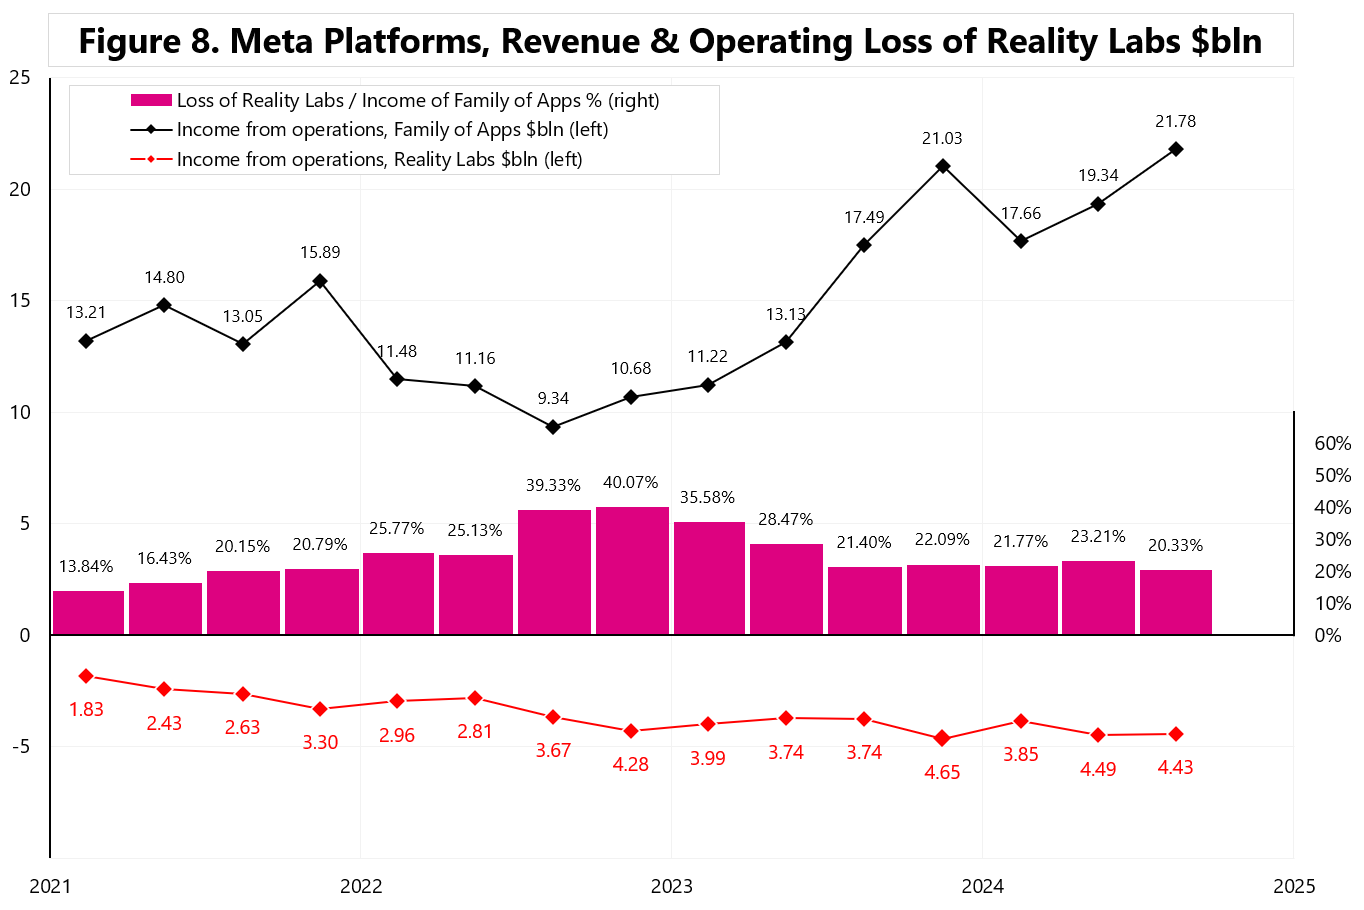
Figure 8 shows how much of the operating profit (of the Family of Apps segment) is the operating loss of the Reality Labs.

Niniejszy materiał jest informacją reklamową. Ma charakter edukacyjno-informacyjny i stanowi wyraz własnych ocen, przemyśleń i opinii autora. Niniejszy materiał służy jedynie celom informacyjnym i nie stanowi oferty, w tym oferty w rozumieniu art. 66 oraz zaproszenia do zawarcia umowy w rozumieniu art. 71 ustawy z dnia 23 kwietnia 1964 r. – Kodeks cywilny (t.j. Dz. U. z 2020 r. poz. 1740, 2320), ani oferty publicznej w rozumieniu art. 3 ustawy z dnia 29 lipca 2005 r. o ofercie publicznej i warunkach wprowadzania instrumentów finansowych do zorganizowanego systemu obrotu oraz o spółkach publicznych (t.j. Dz. U. z 2022 r. poz. 2554, z 2023 r. poz. 825, 1723) czy też oferty publicznej w rozumieniu art 2 lit d) Rozporządzenia Parlamentu Europejskiego i Rady (UE) 2017/1129 z dnia 14 czerwca 2017 r. w sprawie prospektu, który ma być publikowany w związku z ofertą publiczną papierów wartościowych lub dopuszczeniem ich do obrotu na rynku regulowanym oraz uchylenia dyrektywy 2003/71/WE (Dz. Urz. UE L 168 z 30.06.2017, str. 12); Niniejszy materiał nie stanowi także rekomendacji, zaproszenia, ani usług doradztwa. prawnego, podatkowego, finansowego lub inwestycyjnego, związanego z inwestowaniem w jakiekolwiek papiery wartościowe. Materiał ten nie może stanowić podstawy do podjęcia decyzji o dokonaniu jakiejkolwiek inwestycji w papiery wartościowe czy instrumenty finansowe. Informacje zamieszczone w materiale nie stanowią rekomendacji w rozumieniu przepisów Rozporządzenia Parlamentu Europejskiego i Rady (UE) NR 596/2014 z dnia 16 kwietnia 2014 r. w sprawie nadużyć na rynku (rozporządzenie w sprawie nadużyć na rynku) oraz uchylające dyrektywę 2003/6/ WE Parlamentu Europejskiego i Rady i dyrektywy Komisji 2003/124/WE, 2003/125/WE i 2004/72/ WE. (Dz. U UE L 173/1 z dnia 12.06.20114). NDM S.A., nie ponosi odpowiedzialności za prawdziwość, rzetelność i kompletność oraz aktualność danych i informacji zamieszczonych w niniejszej prezentacji. NDM S.A. nie ponosi również jakiejkolwiek odpowiedzialności za szkody wynikające z wykorzystania niniejszego materiału, informacji i danych w nim zawartych. Zawartość materiału została przygotowana na podstawie opracowań sporządzonych zgodnie z najlepszą wiedzą NDM S.A. oraz przy wykorzystaniu informacji i danych publicznie dostępnych, chyba, że wyraźnie wskazano inne źródło pochodzenia danych.

