Komentarz poranny 10.03.2025
Komentarz poranny 10.03.2025 Read More »

![]()
Autor: Jarosław Jamka
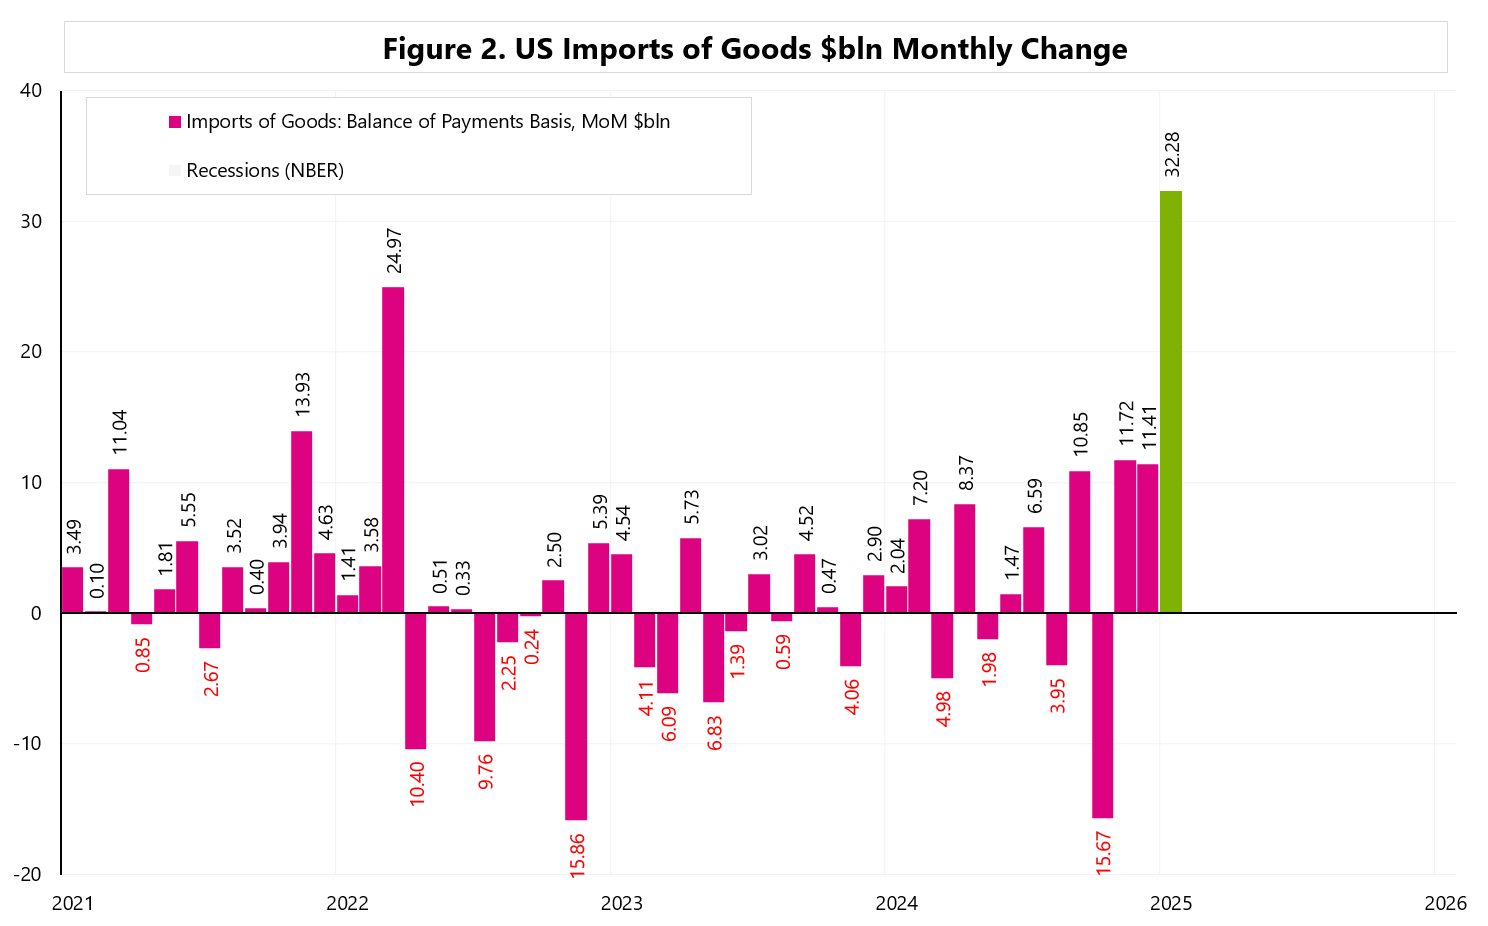
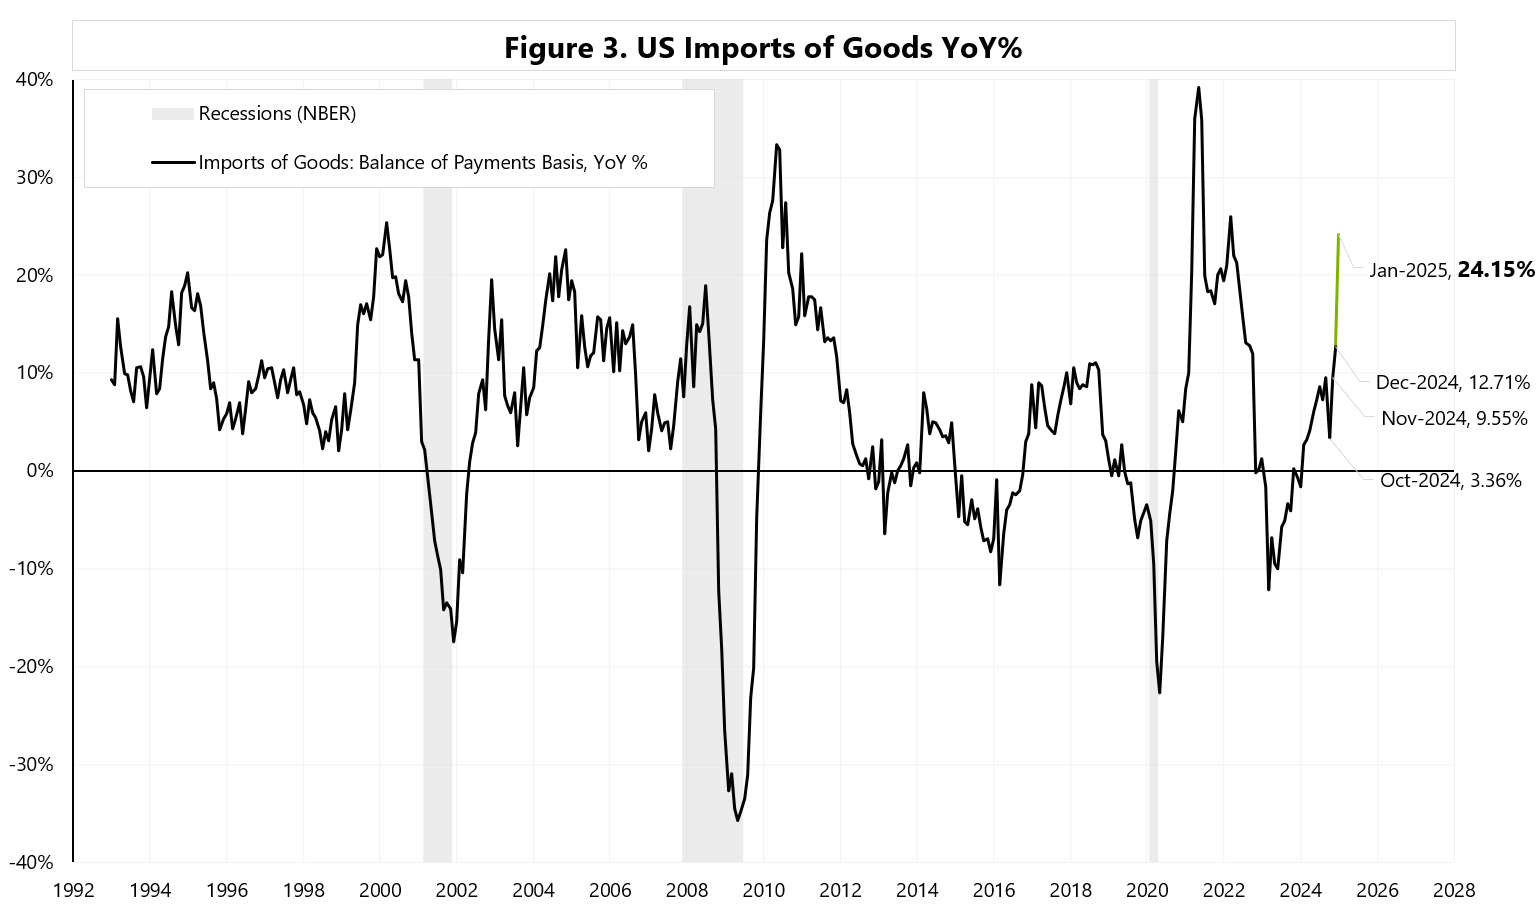
Widespread expectations of higher tariffs have boosted goods imports, as seen in preliminary data for January: +$32 billion MoM; +24.1% YoY – see Figures 1, 2 and 3.
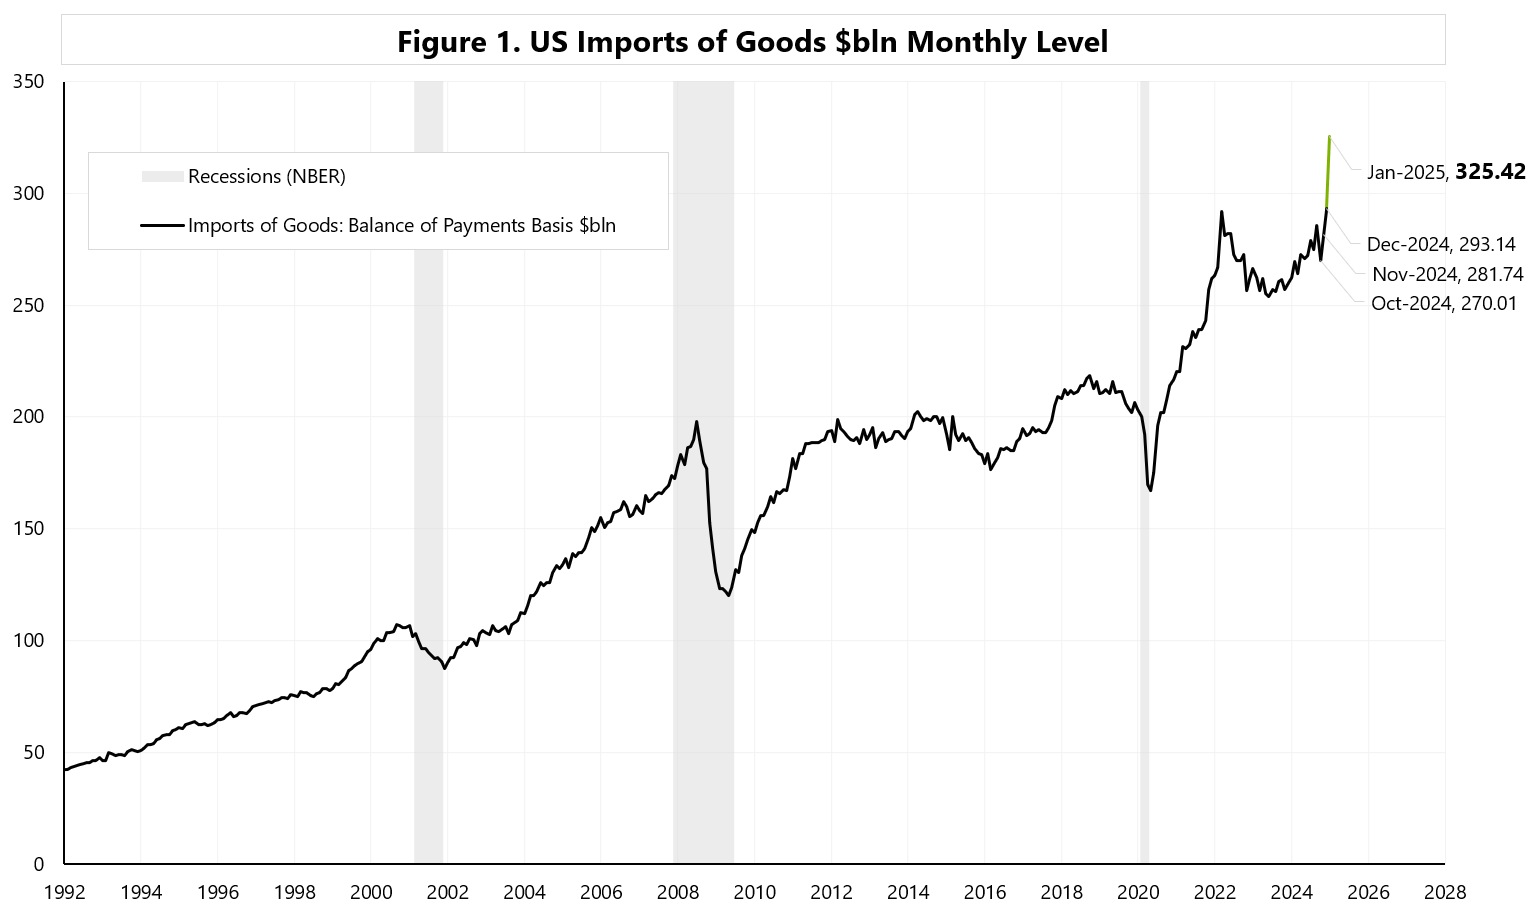
Increased imports have upended Q1 2025 GDP – the Atlanta GDP tracker is now negative at -1.5% – but that is due to a negative contribution from net exports of as much as 3.7 percentage points (the contribution was only -0.4 on 26 February) – see Table 1.
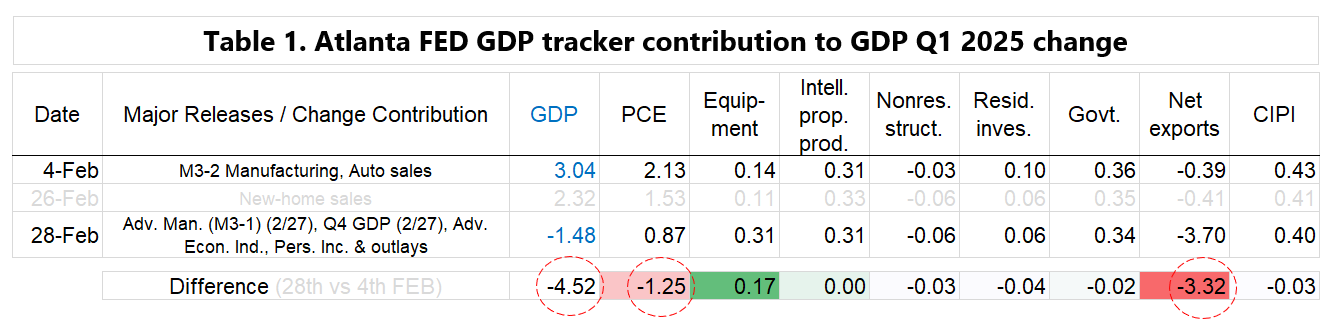
While net exports can be ignored, the same cannot be said for weaker PCE consumer spending… where the PCE contribution to GDP growth in Q1 2025 fell from +2.13 pp on 4 February to only +0.87 pp on 28 February – see Table 1.
The PCE growth forecast for Q1 has also fallen significantly to only +1.29% (from +4.1% on 3 February) – see Figure 4. This is of course a consequence of the decline in PCE spending for January 2025, which fell by MoM 0.2% – see Figure 5.
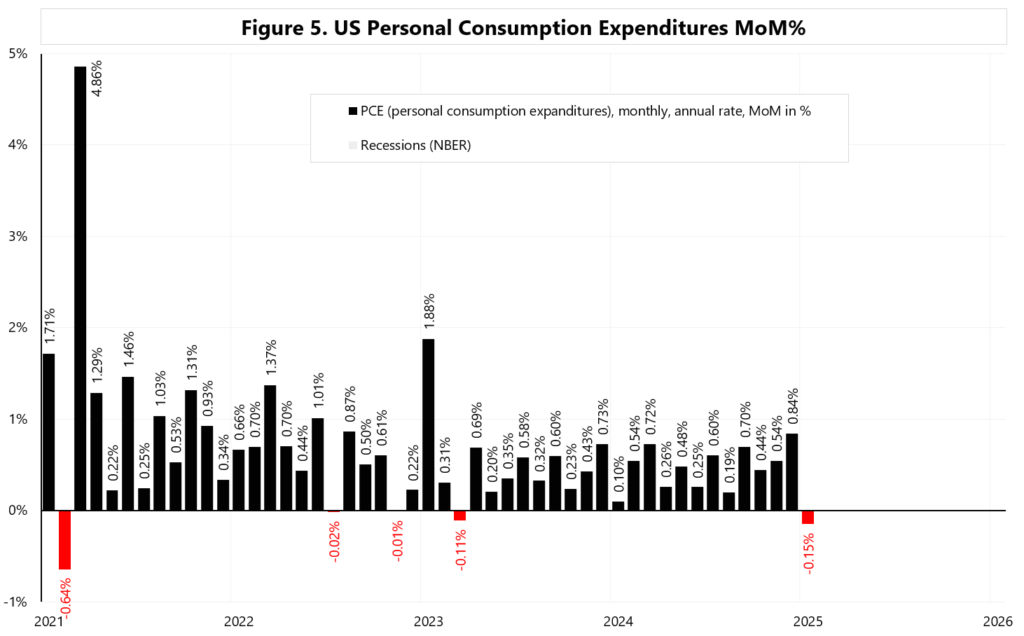
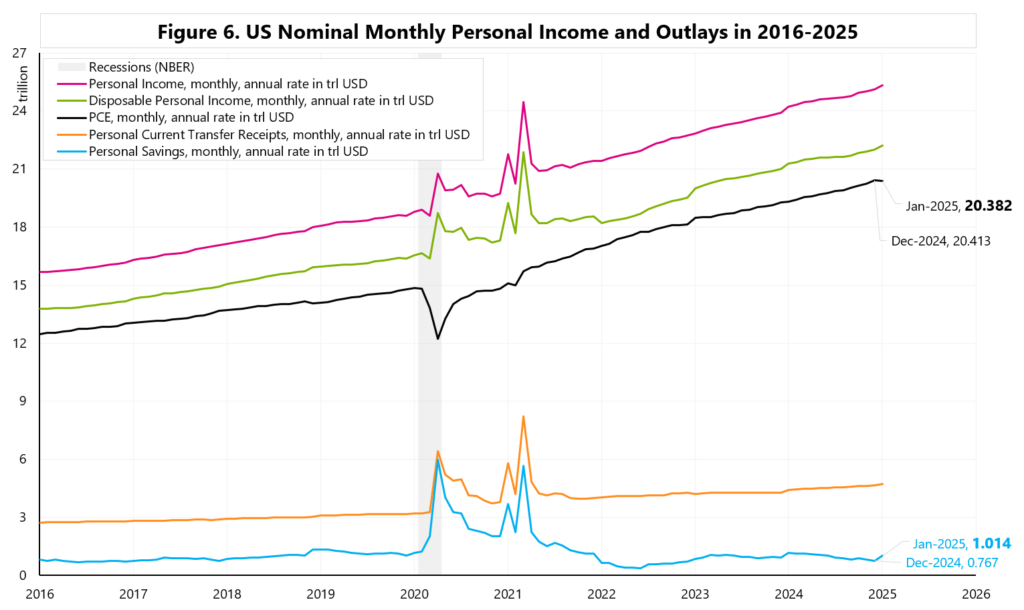
Figure 6 shows the main nominal data series from the Personal Income and Outlays report.
All-in-all, if the “Growth scare” could eventually reduce “inflation scare” – that would allow the Fed to cut interest rates… and at this stage of the cycle, rate cuts could still be positive for risk assets (ala Goldilocks scenario).
Niniejszy materiał jest informacją reklamową. Ma charakter edukacyjno-informacyjny i stanowi wyraz własnych ocen, przemyśleń i opinii autora. Niniejszy materiał służy jedynie celom informacyjnym i nie stanowi oferty, w tym oferty w rozumieniu art. 66 oraz zaproszenia do zawarcia umowy w rozumieniu art. 71 ustawy z dnia 23 kwietnia 1964 r. – Kodeks cywilny (t.j. Dz. U. z 2020 r. poz. 1740, 2320), ani oferty publicznej w rozumieniu art. 3 ustawy z dnia 29 lipca 2005 r. o ofercie publicznej i warunkach wprowadzania instrumentów finansowych do zorganizowanego systemu obrotu oraz o spółkach publicznych (t.j. Dz. U. z 2022 r. poz. 2554, z 2023 r. poz. 825, 1723) czy też oferty publicznej w rozumieniu art 2 lit d) Rozporządzenia Parlamentu Europejskiego i Rady (UE) 2017/1129 z dnia 14 czerwca 2017 r. w sprawie prospektu, który ma być publikowany w związku z ofertą publiczną papierów wartościowych lub dopuszczeniem ich do obrotu na rynku regulowanym oraz uchylenia dyrektywy 2003/71/WE (Dz. Urz. UE L 168 z 30.06.2017, str. 12); Niniejszy materiał nie stanowi także rekomendacji, zaproszenia, ani usług doradztwa. prawnego, podatkowego, finansowego lub inwestycyjnego, związanego z inwestowaniem w jakiekolwiek papiery wartościowe. Materiał ten nie może stanowić podstawy do podjęcia decyzji o dokonaniu jakiejkolwiek inwestycji w papiery wartościowe czy instrumenty finansowe. Informacje zamieszczone w materiale nie stanowią rekomendacji w rozumieniu przepisów Rozporządzenia Parlamentu Europejskiego i Rady (UE) NR 596/2014 z dnia 16 kwietnia 2014 r. w sprawie nadużyć na rynku (rozporządzenie w sprawie nadużyć na rynku) oraz uchylające dyrektywę 2003/6/ WE Parlamentu Europejskiego i Rady i dyrektywy Komisji 2003/124/WE, 2003/125/WE i 2004/72/ WE. (Dz. U UE L 173/1 z dnia 12.06.20114). NDM S.A., nie ponosi odpowiedzialności za prawdziwość, rzetelność i kompletność oraz aktualność danych i informacji zamieszczonych w niniejszej prezentacji. NDM S.A. nie ponosi również jakiejkolwiek odpowiedzialności za szkody wynikające z wykorzystania niniejszego materiału, informacji i danych w nim zawartych. Zawartość materiału została przygotowana na podstawie opracowań sporządzonych zgodnie z najlepszą wiedzą NDM S.A. oraz przy wykorzystaniu informacji i danych publicznie dostępnych, chyba, że wyraźnie wskazano inne źródło pochodzenia danych.
Can “growth scare” overturn “inflation scare”? Read More »
Autor: Jarosław Jamka
Immediately after Trump won the election, both Tesla and Bitcoin took off like a rocket… Tesla +91% and Bitcoin (only) +52% – see Figure 1.
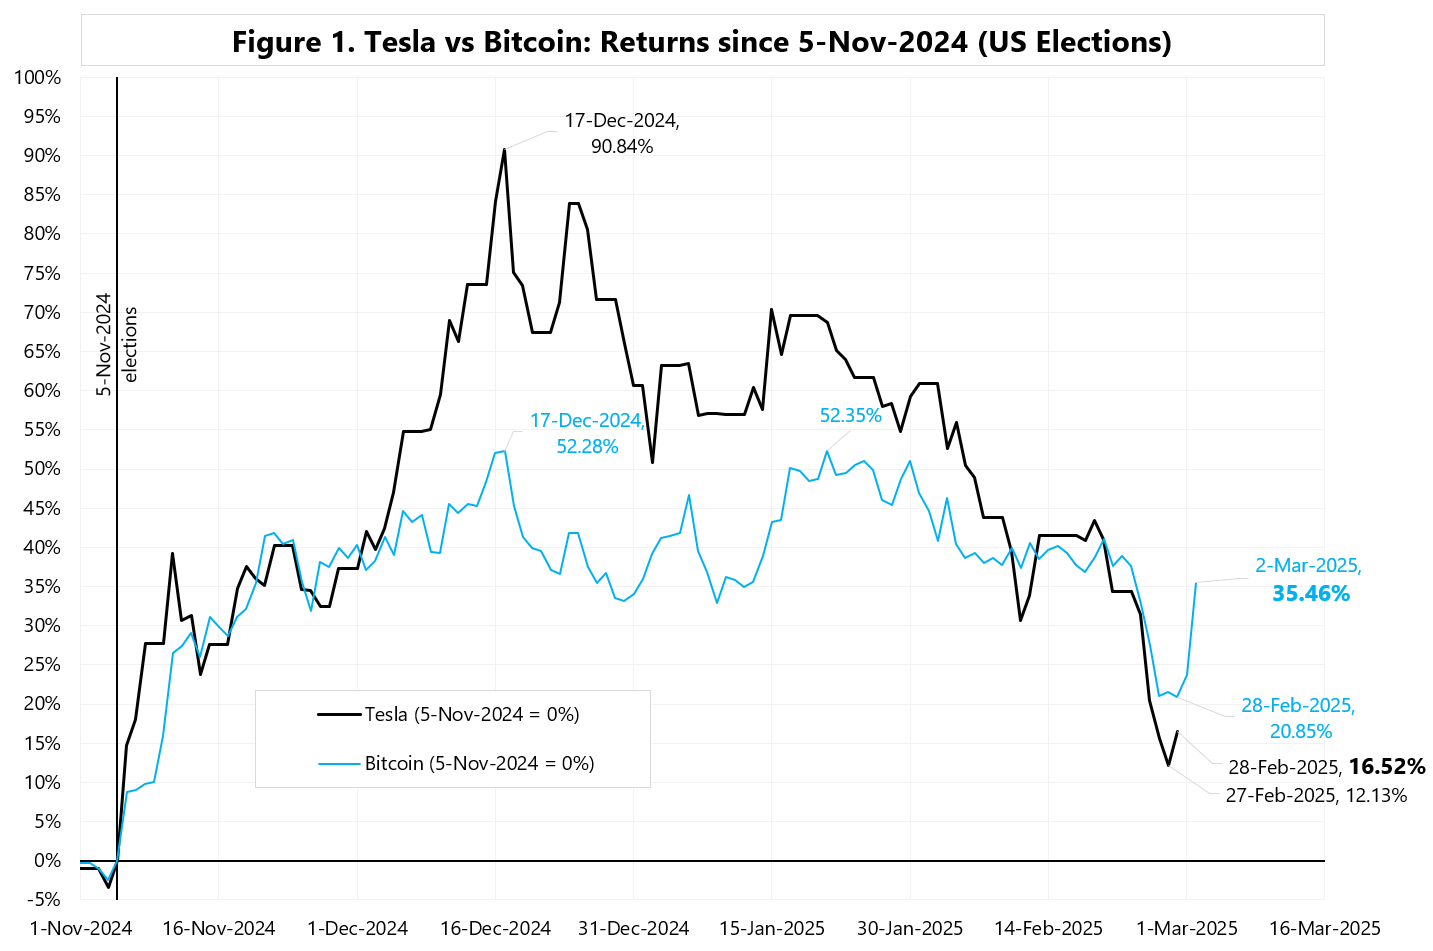
However, from the top, Tesla was down 41% and Bitcoin 21% – see Figure 2.
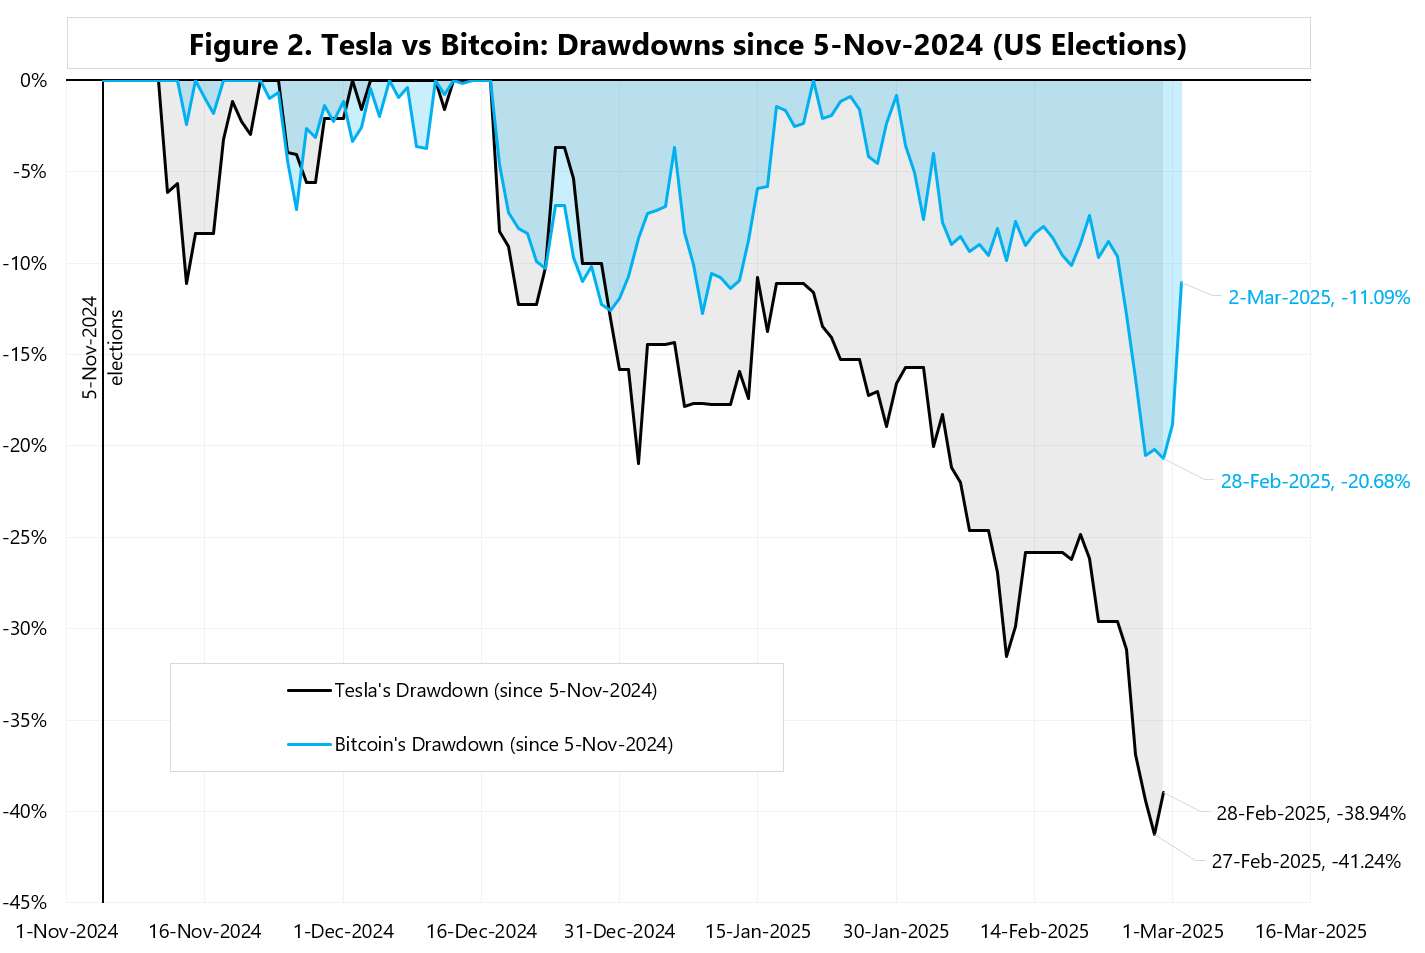
Bitcoin is currently up about 10% on the news that President Trump is keeping his promise to make the U.S. the “Crypto Capital of the World.”
Will Tesla follow Bitcoin? We’ll soon find out if this is the same trade… 🙂
Niniejszy materiał jest informacją reklamową. Ma charakter edukacyjno-informacyjny i stanowi wyraz własnych ocen, przemyśleń i opinii autora. Niniejszy materiał służy jedynie celom informacyjnym i nie stanowi oferty, w tym oferty w rozumieniu art. 66 oraz zaproszenia do zawarcia umowy w rozumieniu art. 71 ustawy z dnia 23 kwietnia 1964 r. – Kodeks cywilny (t.j. Dz. U. z 2020 r. poz. 1740, 2320), ani oferty publicznej w rozumieniu art. 3 ustawy z dnia 29 lipca 2005 r. o ofercie publicznej i warunkach wprowadzania instrumentów finansowych do zorganizowanego systemu obrotu oraz o spółkach publicznych (t.j. Dz. U. z 2022 r. poz. 2554, z 2023 r. poz. 825, 1723) czy też oferty publicznej w rozumieniu art 2 lit d) Rozporządzenia Parlamentu Europejskiego i Rady (UE) 2017/1129 z dnia 14 czerwca 2017 r. w sprawie prospektu, który ma być publikowany w związku z ofertą publiczną papierów wartościowych lub dopuszczeniem ich do obrotu na rynku regulowanym oraz uchylenia dyrektywy 2003/71/WE (Dz. Urz. UE L 168 z 30.06.2017, str. 12); Niniejszy materiał nie stanowi także rekomendacji, zaproszenia, ani usług doradztwa. prawnego, podatkowego, finansowego lub inwestycyjnego, związanego z inwestowaniem w jakiekolwiek papiery wartościowe. Materiał ten nie może stanowić podstawy do podjęcia decyzji o dokonaniu jakiejkolwiek inwestycji w papiery wartościowe czy instrumenty finansowe. Informacje zamieszczone w materiale nie stanowią rekomendacji w rozumieniu przepisów Rozporządzenia Parlamentu Europejskiego i Rady (UE) NR 596/2014 z dnia 16 kwietnia 2014 r. w sprawie nadużyć na rynku (rozporządzenie w sprawie nadużyć na rynku) oraz uchylające dyrektywę 2003/6/ WE Parlamentu Europejskiego i Rady i dyrektywy Komisji 2003/124/WE, 2003/125/WE i 2004/72/ WE. (Dz. U UE L 173/1 z dnia 12.06.20114). NDM S.A., nie ponosi odpowiedzialności za prawdziwość, rzetelność i kompletność oraz aktualność danych i informacji zamieszczonych w niniejszej prezentacji. NDM S.A. nie ponosi również jakiejkolwiek odpowiedzialności za szkody wynikające z wykorzystania niniejszego materiału, informacji i danych w nim zawartych. Zawartość materiału została przygotowana na podstawie opracowań sporządzonych zgodnie z najlepszą wiedzą NDM S.A. oraz przy wykorzystaniu informacji i danych publicznie dostępnych, chyba, że wyraźnie wskazano inne źródło pochodzenia danych.
Cause It Takes Two To Tango! Read More »

Autor: Jarosław Jamka
Over the last two trading days, the złoty (PLN) has weakened against the euro by 1.3%. This is the largest correction since the US presidential election (November 5, 2024). Interestingly, at the same time the eurodollar also fell by about 1.3%. This is the first such situation (since the US election) that the PLN weakens when the dollar strengthens against the euro. Of course, this is all related to the failure of the talks between Ukraine and the US. The FX market (PLN, HUF, CZK) interprets this failure as a smaller chance of concluding peace/ceasefire in Ukraine (i.e. further war). See Figure 1.
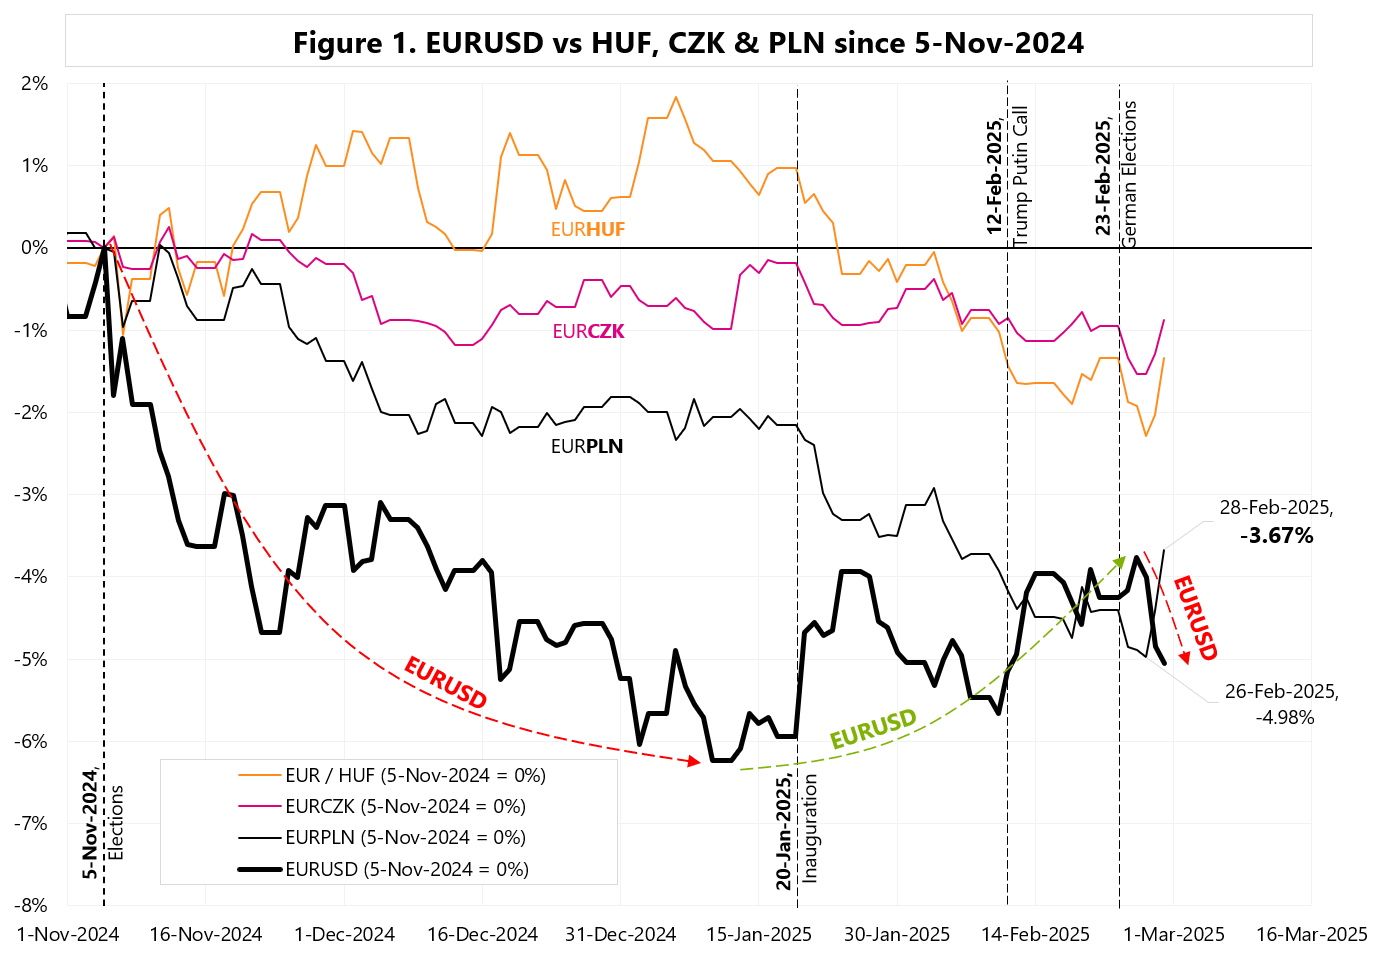
We will see whether this interpretation holds in the coming days.
In his latest podcast entitled „Trump, Putin and Changing Global Realities”, George Friedman discussed in detail the realities of geopolitics and possible solutions. But as history suggests, at the end of the day, geopolitics may have little to do with morality…
George Friedman: “the consequences of geopolitics is power, it is not what you want to do or what you think is moral, it is what you must do and what you can do. And so in this particular case as in many cases where nations were victimized by geopolitics like Vietnam which we fought not because we cared about Vietnam but because we wanted to stop communism and signal that we would not stop at anything to do it. So there are victims when systems change.”
According to Friedman, it is at this moment that we are dealing with a change in the system as a direct result of Russia’s defeat in Ukraine: „the critical thing to understand is that when Russia invaded Ukraine and failed the world changed. It was not the other way around.”
And some more: “Russia lost the war in Ukraine. The Russian army could not defeat what is nearly a third world country for three years, it failed, this is a massive failure by the Russians”.
Niniejszy materiał jest informacją reklamową. Ma charakter edukacyjno-informacyjny i stanowi wyraz własnych ocen, przemyśleń i opinii autora. Niniejszy materiał służy jedynie celom informacyjnym i nie stanowi oferty, w tym oferty w rozumieniu art. 66 oraz zaproszenia do zawarcia umowy w rozumieniu art. 71 ustawy z dnia 23 kwietnia 1964 r. – Kodeks cywilny (t.j. Dz. U. z 2020 r. poz. 1740, 2320), ani oferty publicznej w rozumieniu art. 3 ustawy z dnia 29 lipca 2005 r. o ofercie publicznej i warunkach wprowadzania instrumentów finansowych do zorganizowanego systemu obrotu oraz o spółkach publicznych (t.j. Dz. U. z 2022 r. poz. 2554, z 2023 r. poz. 825, 1723) czy też oferty publicznej w rozumieniu art 2 lit d) Rozporządzenia Parlamentu Europejskiego i Rady (UE) 2017/1129 z dnia 14 czerwca 2017 r. w sprawie prospektu, który ma być publikowany w związku z ofertą publiczną papierów wartościowych lub dopuszczeniem ich do obrotu na rynku regulowanym oraz uchylenia dyrektywy 2003/71/WE (Dz. Urz. UE L 168 z 30.06.2017, str. 12); Niniejszy materiał nie stanowi także rekomendacji, zaproszenia, ani usług doradztwa. prawnego, podatkowego, finansowego lub inwestycyjnego, związanego z inwestowaniem w jakiekolwiek papiery wartościowe. Materiał ten nie może stanowić podstawy do podjęcia decyzji o dokonaniu jakiejkolwiek inwestycji w papiery wartościowe czy instrumenty finansowe. Informacje zamieszczone w materiale nie stanowią rekomendacji w rozumieniu przepisów Rozporządzenia Parlamentu Europejskiego i Rady (UE) NR 596/2014 z dnia 16 kwietnia 2014 r. w sprawie nadużyć na rynku (rozporządzenie w sprawie nadużyć na rynku) oraz uchylające dyrektywę 2003/6/ WE Parlamentu Europejskiego i Rady i dyrektywy Komisji 2003/124/WE, 2003/125/WE i 2004/72/ WE. (Dz. U UE L 173/1 z dnia 12.06.20114). NDM S.A., nie ponosi odpowiedzialności za prawdziwość, rzetelność i kompletność oraz aktualność danych i informacji zamieszczonych w niniejszej prezentacji. NDM S.A. nie ponosi również jakiejkolwiek odpowiedzialności za szkody wynikające z wykorzystania niniejszego materiału, informacji i danych w nim zawartych. Zawartość materiału została przygotowana na podstawie opracowań sporządzonych zgodnie z najlepszą wiedzą NDM S.A. oraz przy wykorzystaniu informacji i danych publicznie dostępnych, chyba, że wyraźnie wskazano inne źródło pochodzenia danych.
Significant weakening of the Polish currency! Read More »