
Stronger PLN at the end of the year?
Autor: Jarosław Jamka
When it comes to stronger asset prices at the end of the calendar year, such a seasonal effect is widely known in the case of the stock market (or at least expected by investors every year). In the case of the EURPLN exchange rate, it can be said that since 2017 the zloty has shown an annual tendency to strengthen against the euro (counting from October 31 to January 31 of each year) – see Figure 1. However, this does not apply to the years 2014-2016. In general, the zloty should be stronger when global stock markets are also stronger.
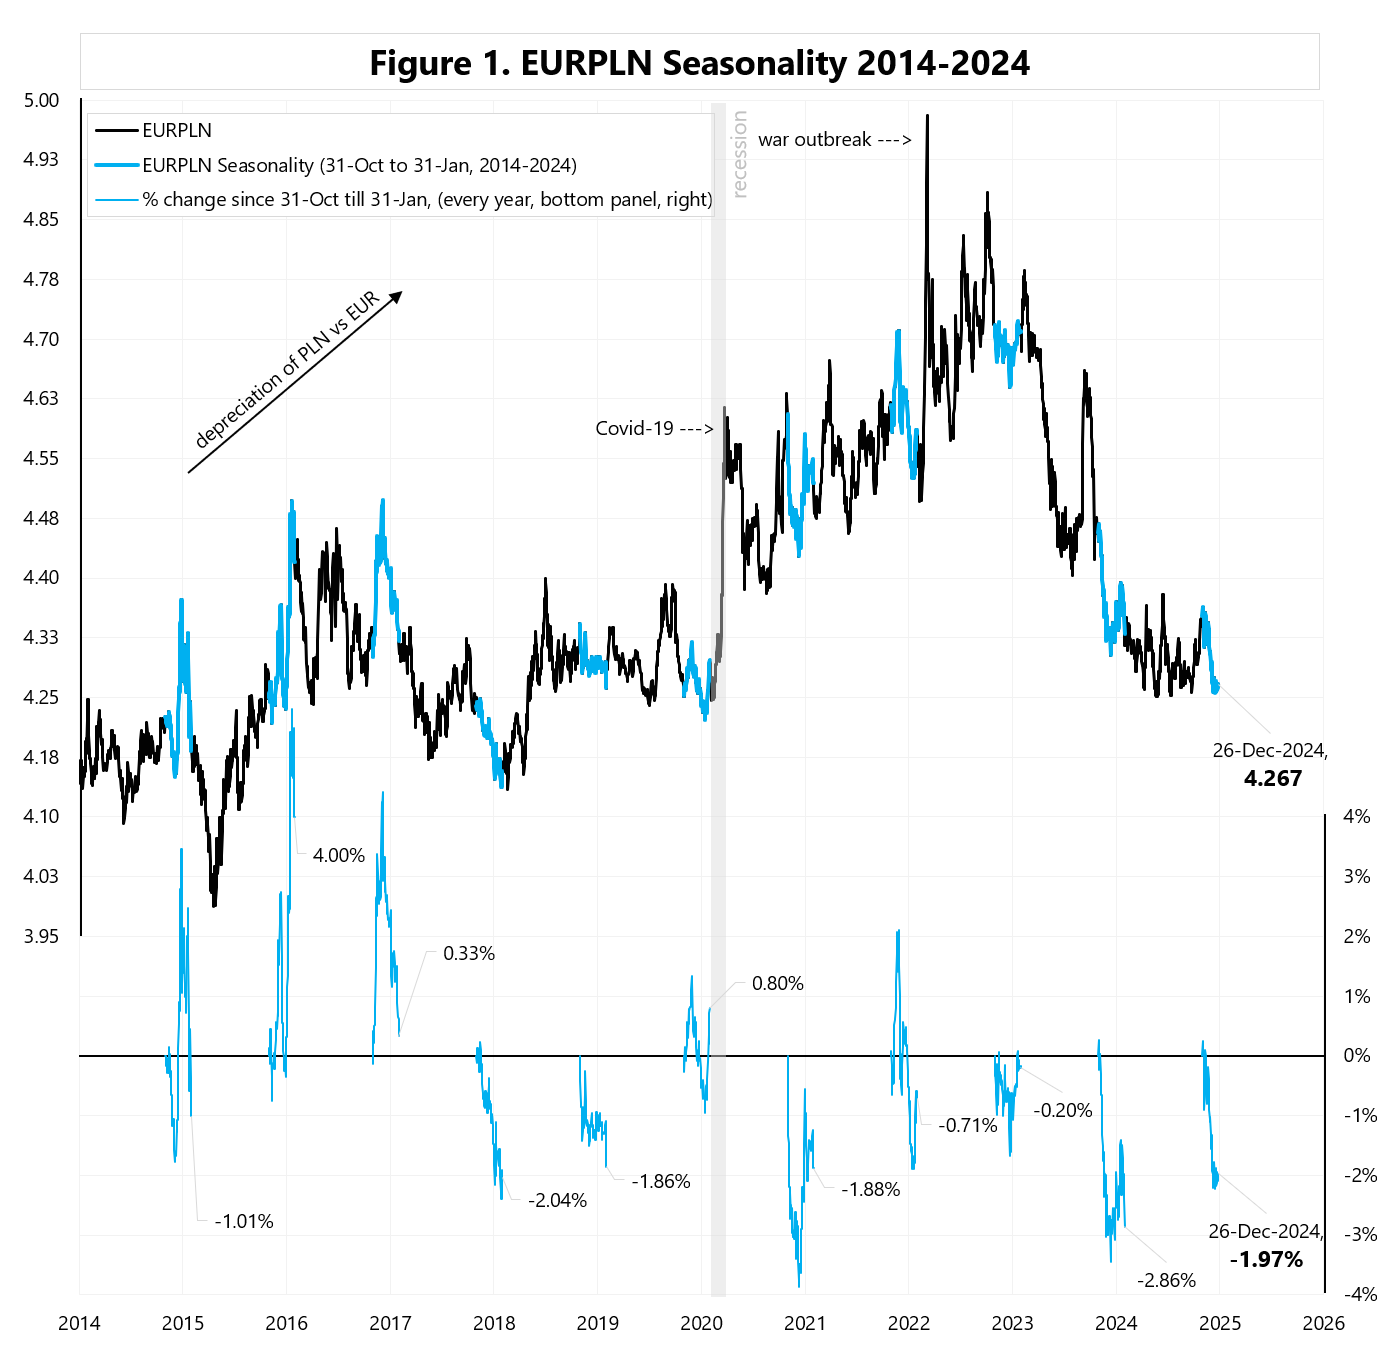
In the current year 2024, so far the zloty strengthened against the euro by 2% from October 31 to December 26 (however, it is currently at the same level as in September 2024).
Figure 2 shows the change in the EURPLN exchange rate from October 31 to January 31 in the years 2014-2023. Figure 3 shows the same, but each year has been rebased to the zloty level on October 31, 2024.

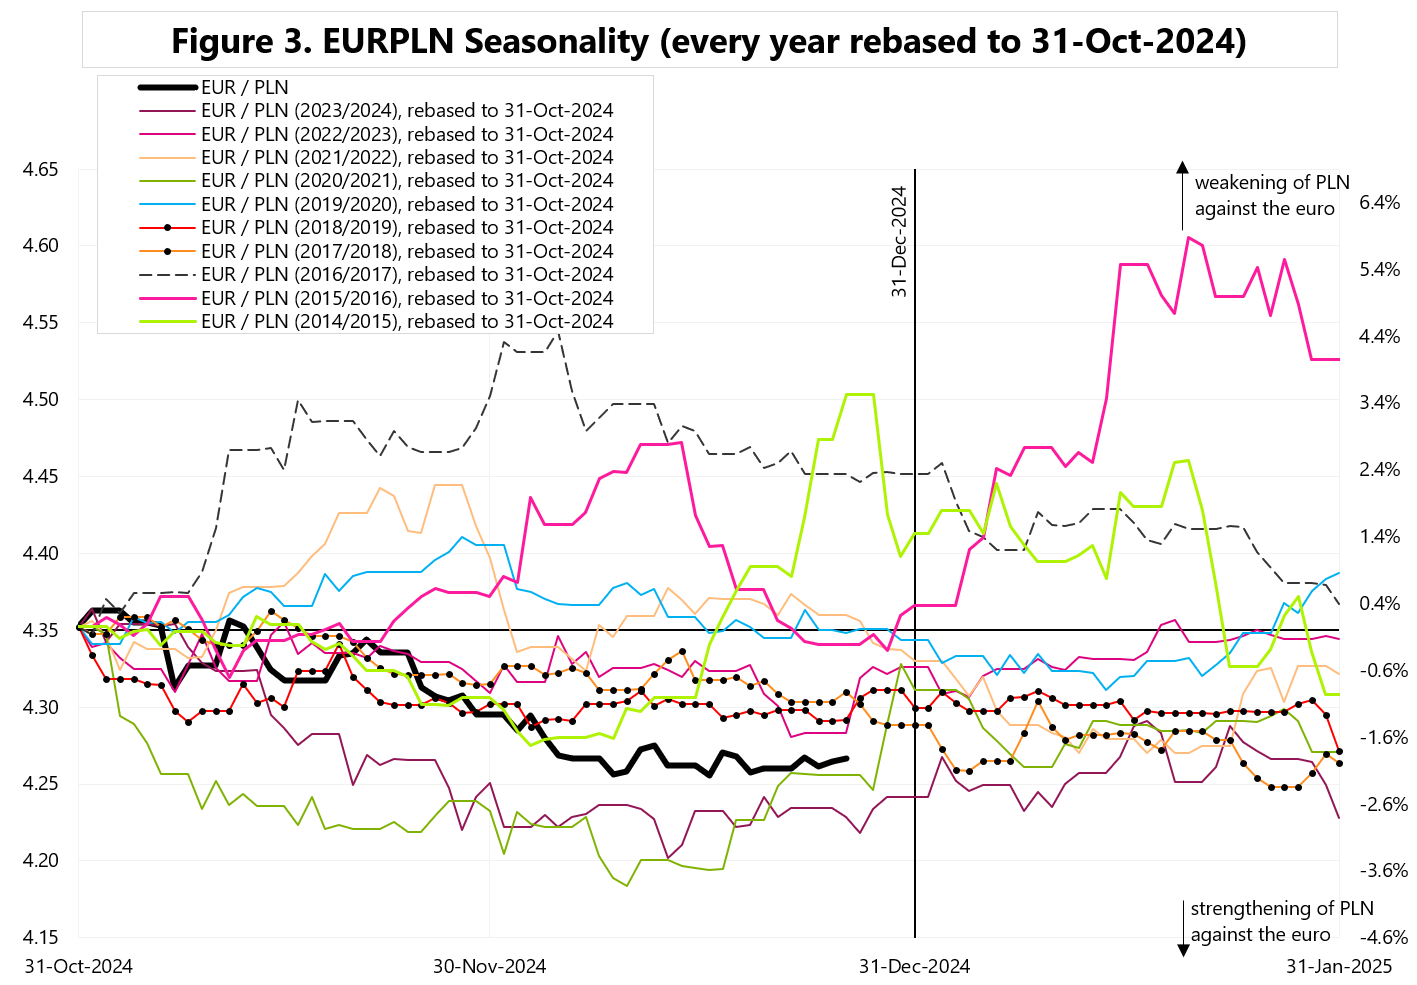
Figure 4 shows the change in the EURPLN exchange rate in 2024 relative to the 2014-2023 average, and the 2017-2023 average.
All in all, one can count on a seasonally stronger zloty (against the euro) in November/December, but this is not a strong and regular seasonal pattern.

Niniejszy materiał jest informacją reklamową. Ma charakter edukacyjno-informacyjny i stanowi wyraz własnych ocen, przemyśleń i opinii autora. Niniejszy materiał służy jedynie celom informacyjnym i nie stanowi oferty, w tym oferty w rozumieniu art. 66 oraz zaproszenia do zawarcia umowy w rozumieniu art. 71 ustawy z dnia 23 kwietnia 1964 r. – Kodeks cywilny (t.j. Dz. U. z 2020 r. poz. 1740, 2320), ani oferty publicznej w rozumieniu art. 3 ustawy z dnia 29 lipca 2005 r. o ofercie publicznej i warunkach wprowadzania instrumentów finansowych do zorganizowanego systemu obrotu oraz o spółkach publicznych (t.j. Dz. U. z 2022 r. poz. 2554, z 2023 r. poz. 825, 1723) czy też oferty publicznej w rozumieniu art 2 lit d) Rozporządzenia Parlamentu Europejskiego i Rady (UE) 2017/1129 z dnia 14 czerwca 2017 r. w sprawie prospektu, który ma być publikowany w związku z ofertą publiczną papierów wartościowych lub dopuszczeniem ich do obrotu na rynku regulowanym oraz uchylenia dyrektywy 2003/71/WE (Dz. Urz. UE L 168 z 30.06.2017, str. 12); Niniejszy materiał nie stanowi także rekomendacji, zaproszenia, ani usług doradztwa. prawnego, podatkowego, finansowego lub inwestycyjnego, związanego z inwestowaniem w jakiekolwiek papiery wartościowe. Materiał ten nie może stanowić podstawy do podjęcia decyzji o dokonaniu jakiejkolwiek inwestycji w papiery wartościowe czy instrumenty finansowe. Informacje zamieszczone w materiale nie stanowią rekomendacji w rozumieniu przepisów Rozporządzenia Parlamentu Europejskiego i Rady (UE) NR 596/2014 z dnia 16 kwietnia 2014 r. w sprawie nadużyć na rynku (rozporządzenie w sprawie nadużyć na rynku) oraz uchylające dyrektywę 2003/6/ WE Parlamentu Europejskiego i Rady i dyrektywy Komisji 2003/124/WE, 2003/125/WE i 2004/72/ WE. (Dz. U UE L 173/1 z dnia 12.06.20114). NDM S.A., nie ponosi odpowiedzialności za prawdziwość, rzetelność i kompletność oraz aktualność danych i informacji zamieszczonych w niniejszej prezentacji. NDM S.A. nie ponosi również jakiejkolwiek odpowiedzialności za szkody wynikające z wykorzystania niniejszego materiału, informacji i danych w nim zawartych. Zawartość materiału została przygotowana na podstawie opracowań sporządzonych zgodnie z najlepszą wiedzą NDM S.A. oraz przy wykorzystaniu informacji i danych publicznie dostępnych, chyba, że wyraźnie wskazano inne źródło pochodzenia danych.
Stronger PLN at the end of the year? Read More »