
¡No muy bueno!
Autor: Jarosław Jamka
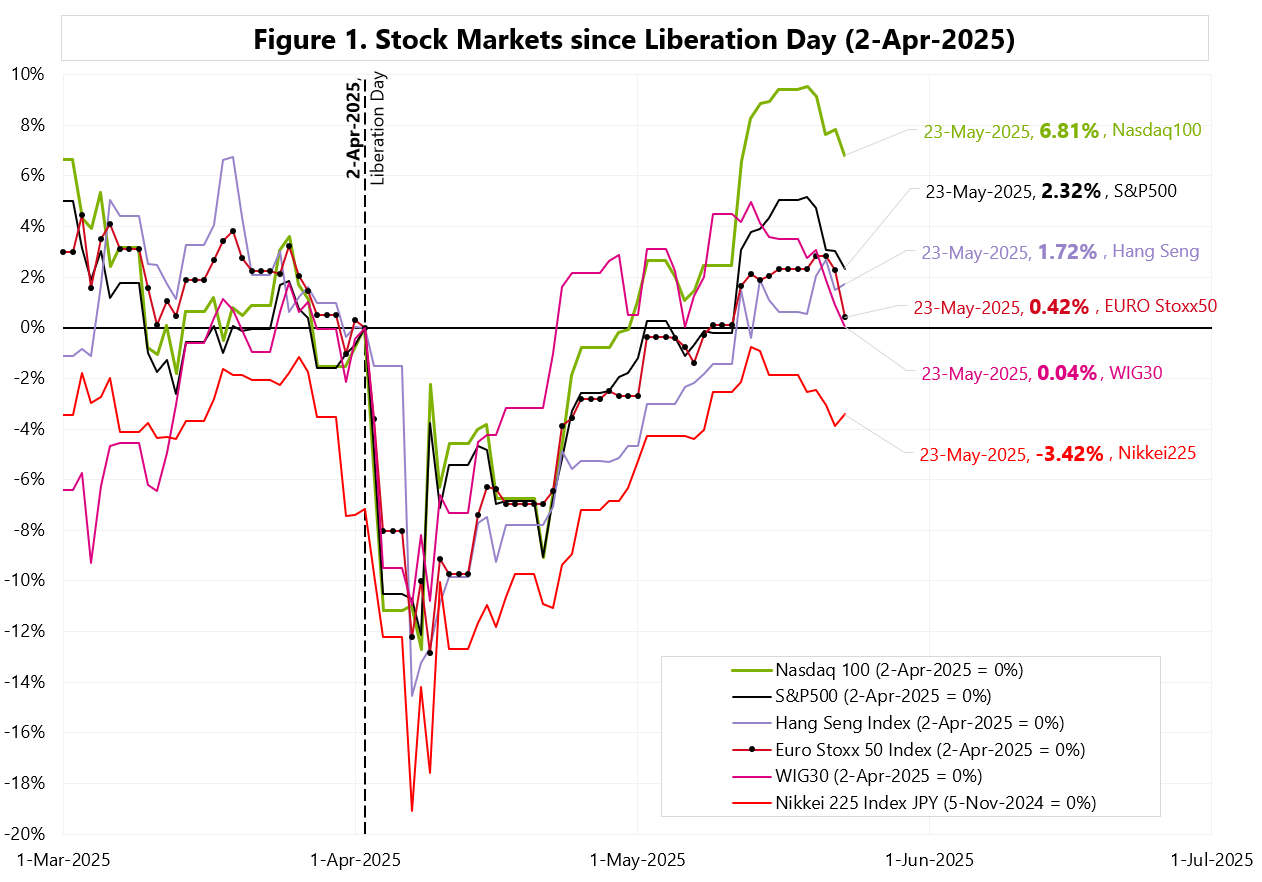
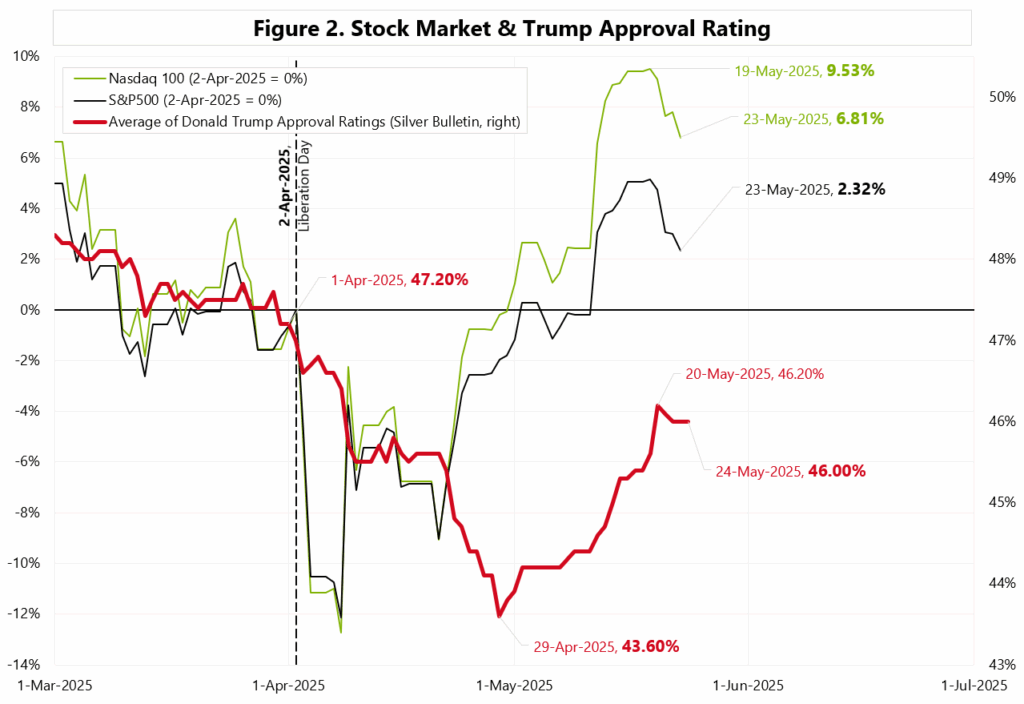
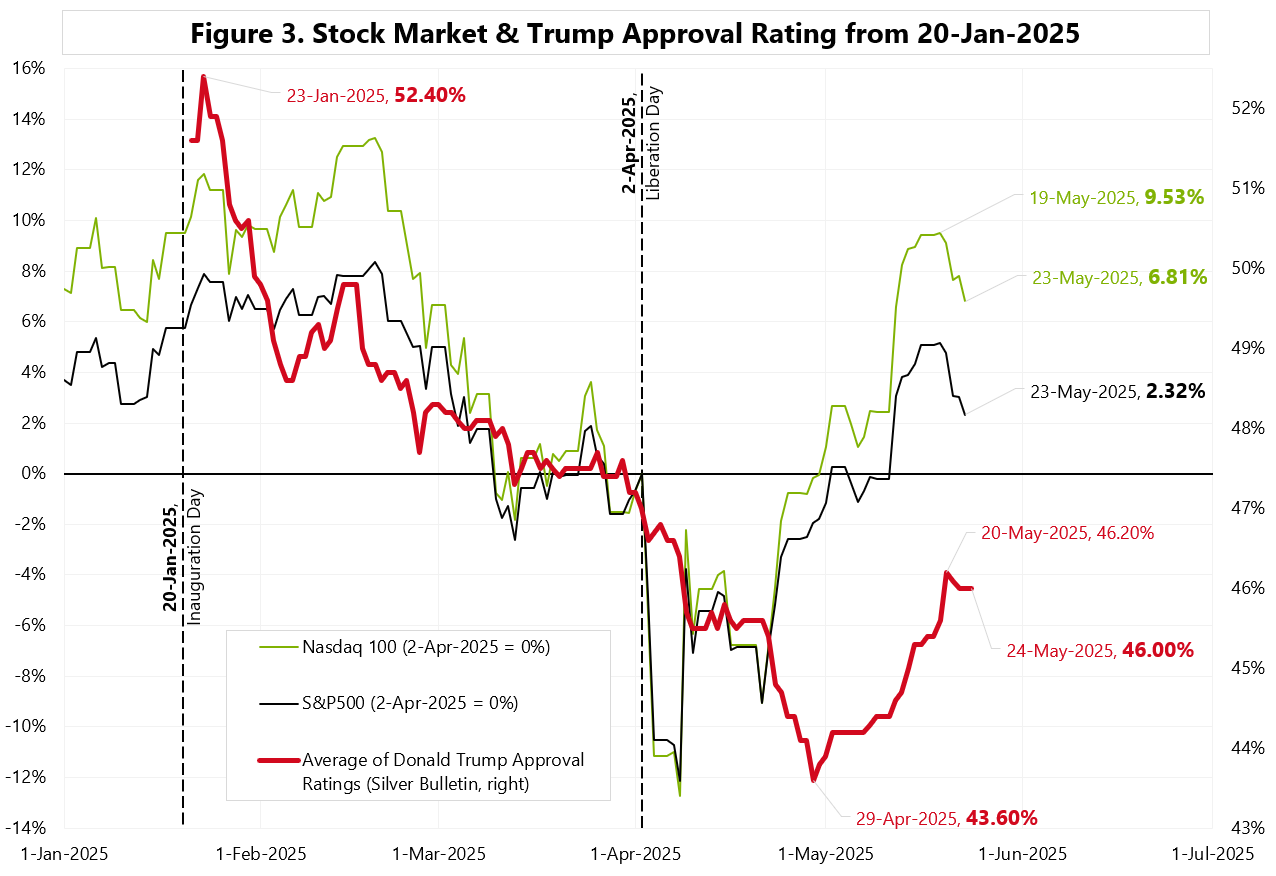
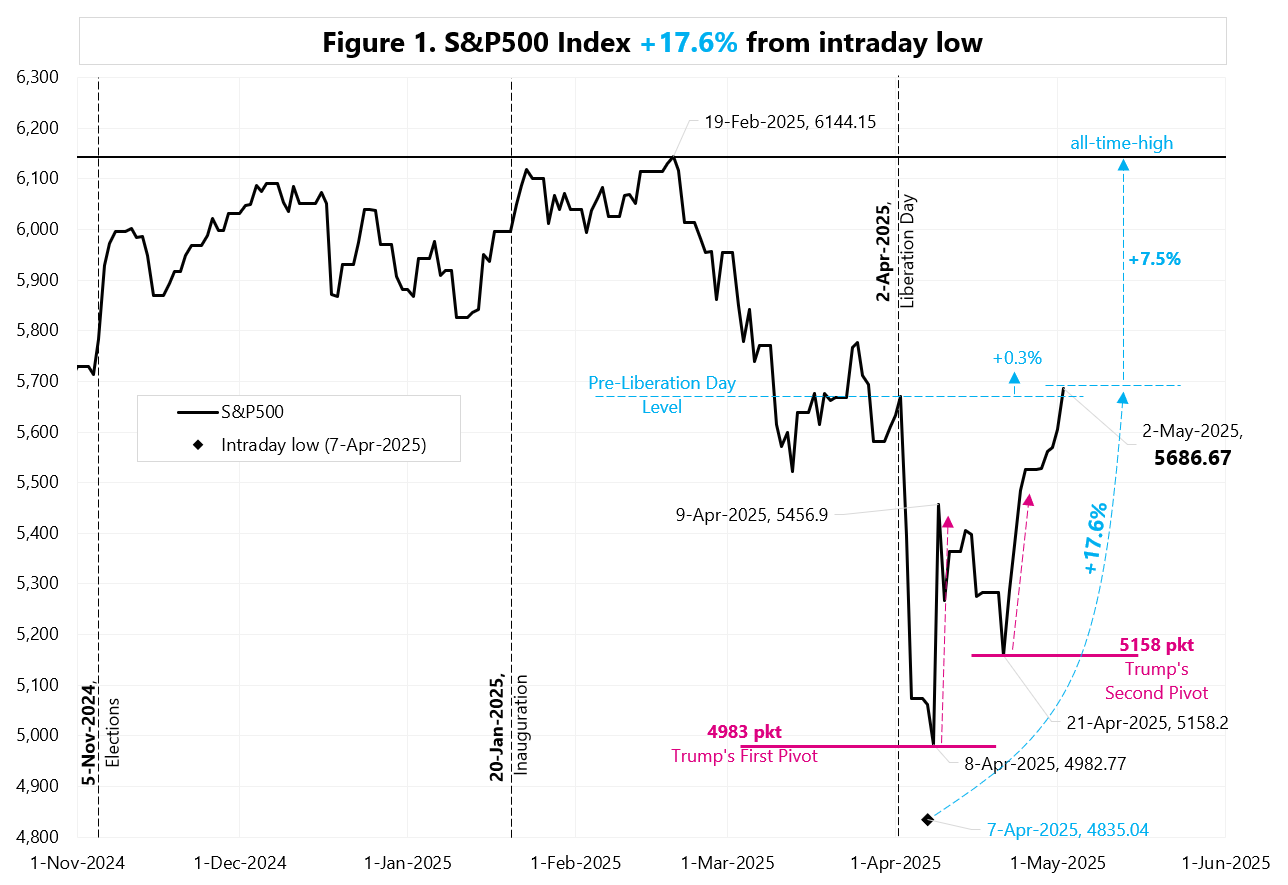
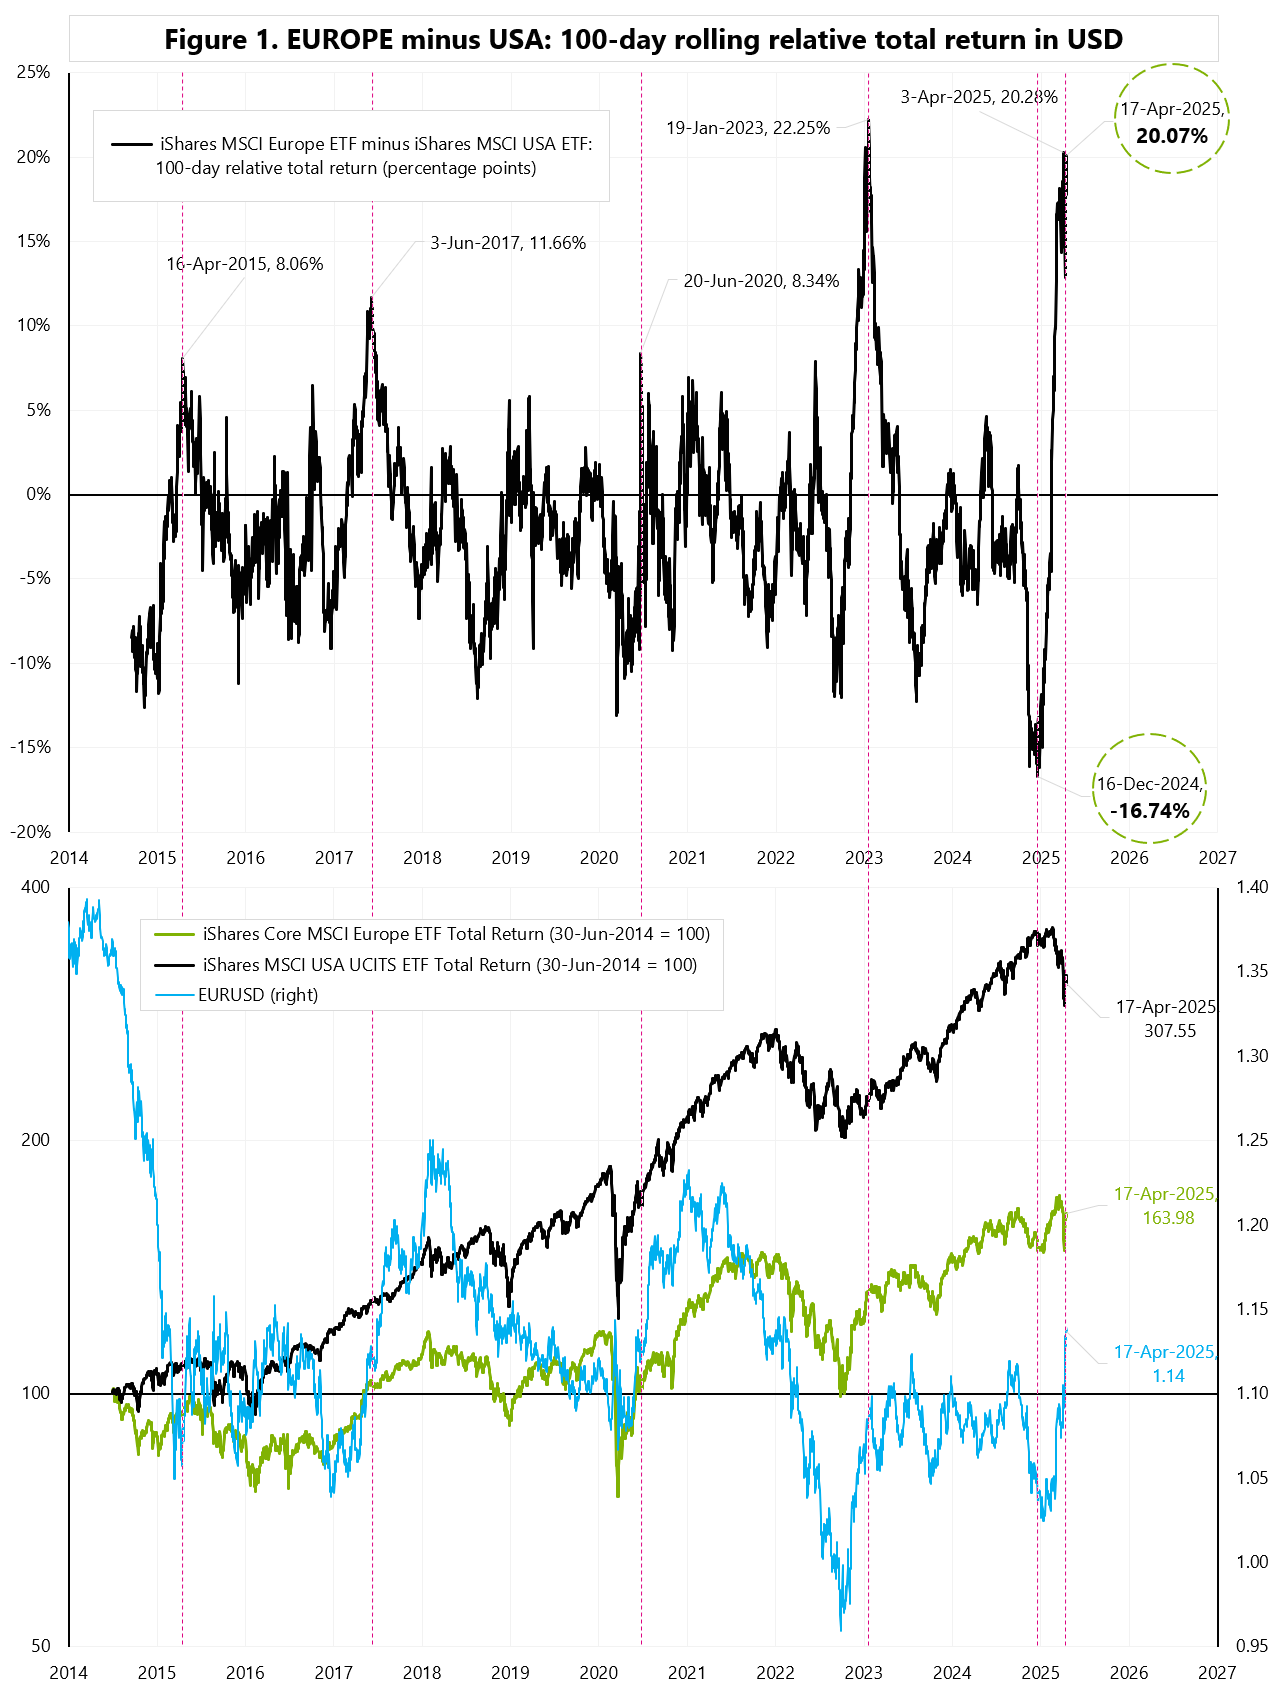
Trump’s approval rating refuses to rise any further and currently stands at 45.9% (according to Silver Bulletin). However, after a brief pause, US stocks are breaking out and it is possible that Trump’s approval rating will also continue to rise. See Figure 1.
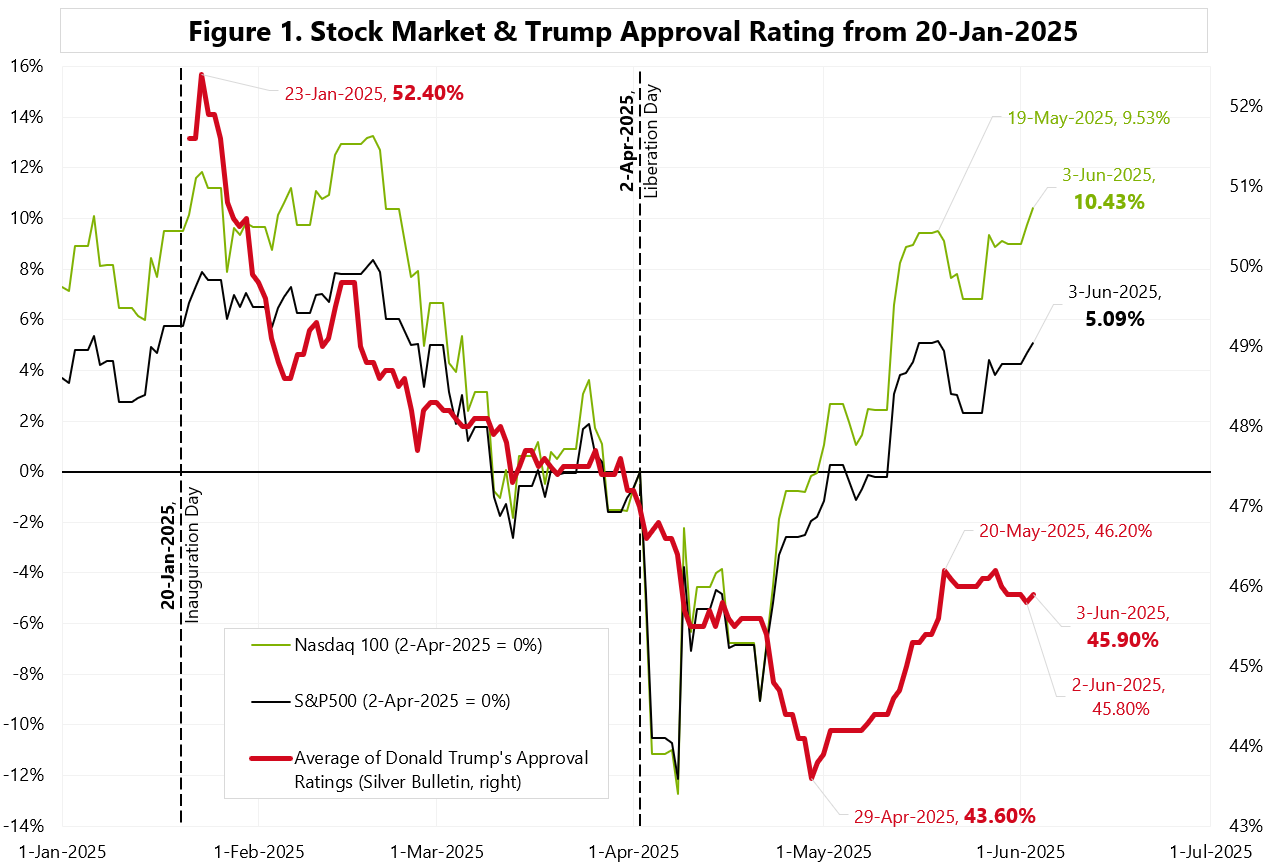
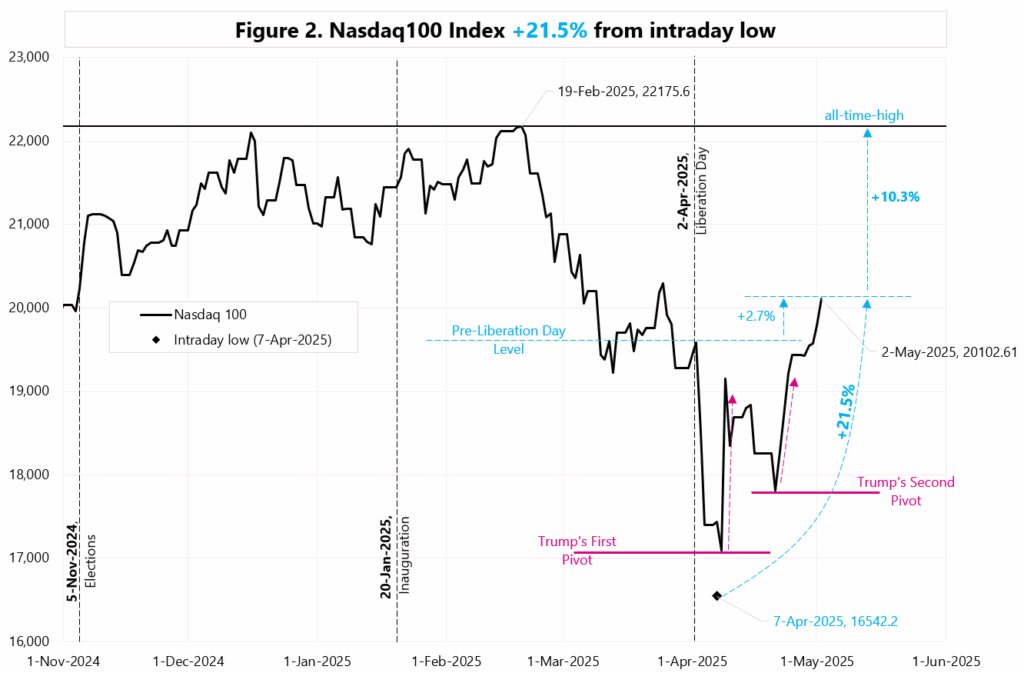
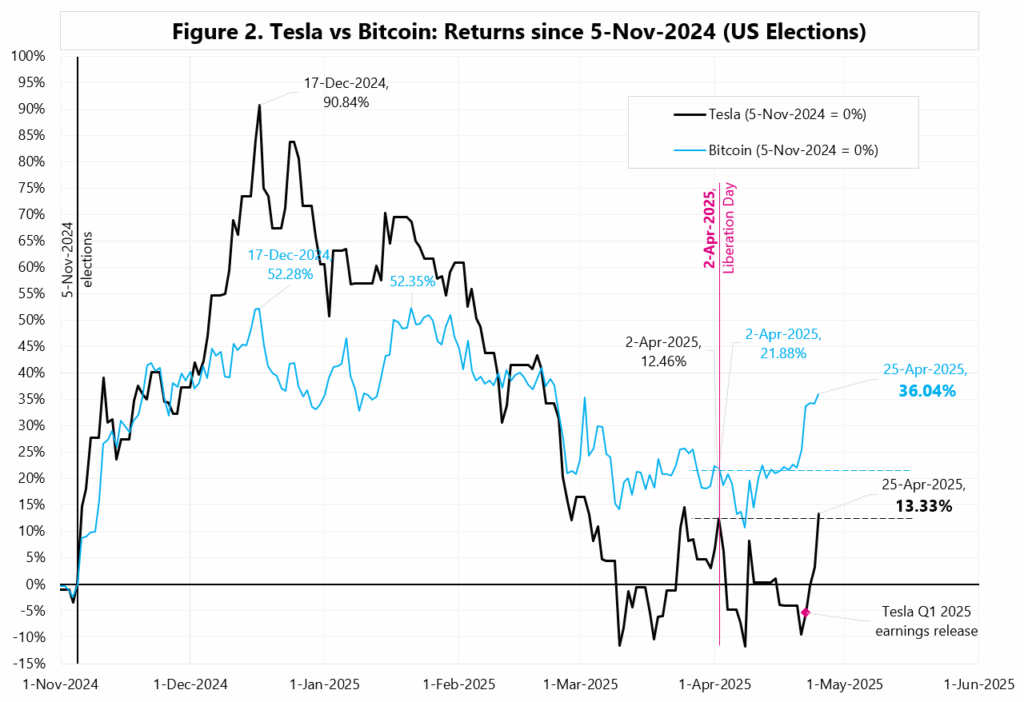
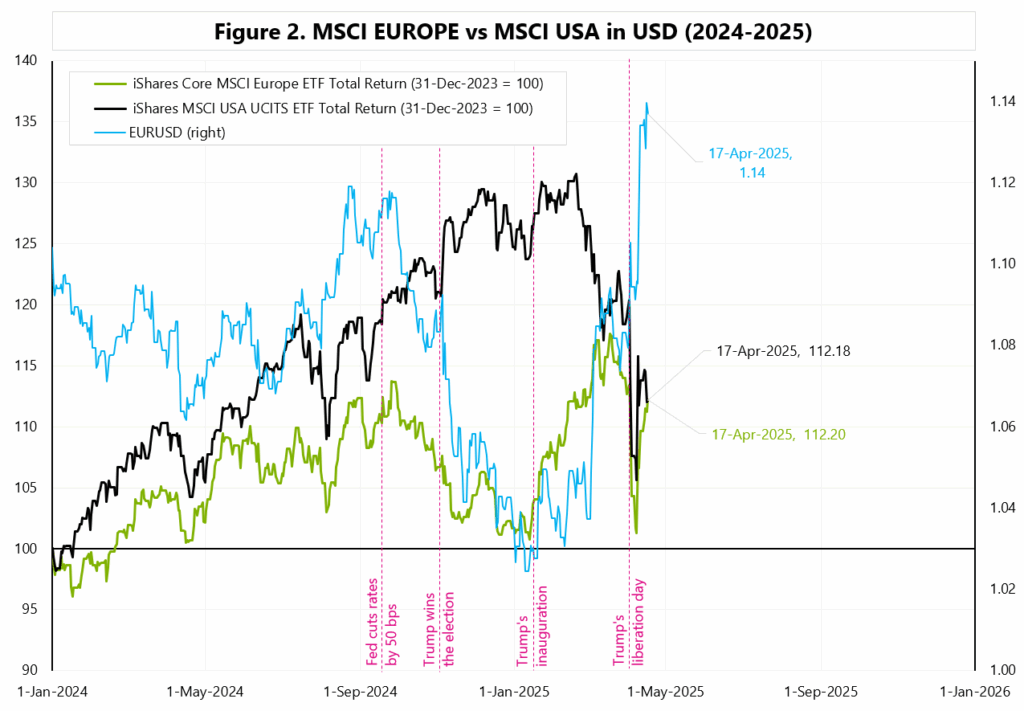
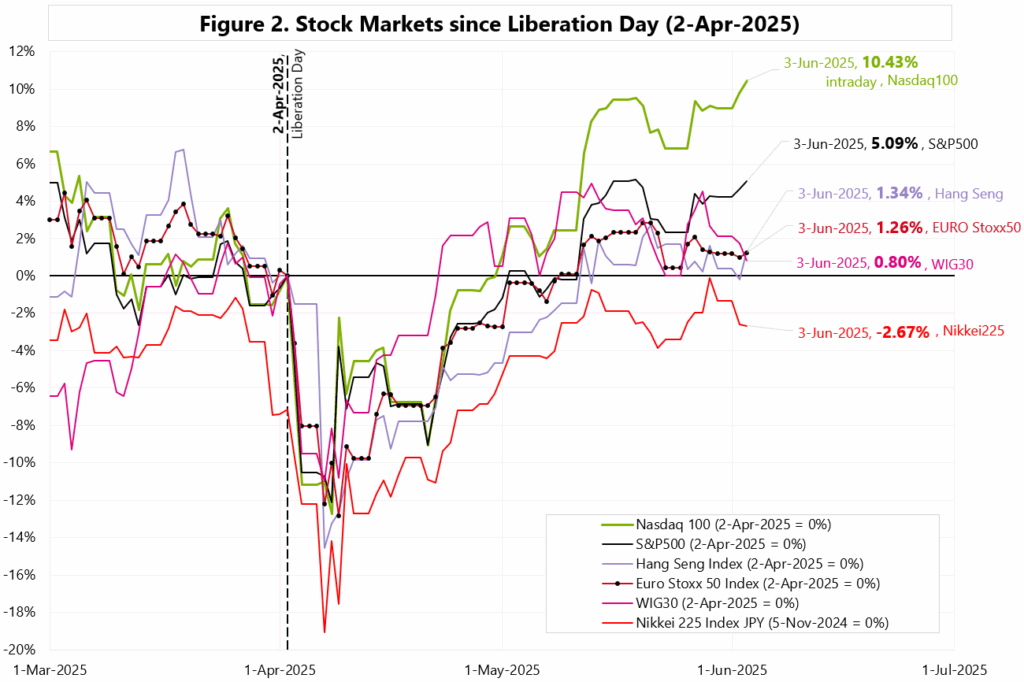
US stocks have been doing quite well since “Liberation Day,” especially the Nasdaq 100, which is now over 10% above its Liberation Day level. See Figure 2.
Trump needs a much higher approval rating to be confident of winning the 2026 midterm elections! If the correlation with stocks continues to hold, this could also be good news for investors!
Niniejszy materiał jest informacją reklamową. Ma charakter edukacyjno-informacyjny i stanowi wyraz własnych ocen, przemyśleń i opinii autora. Niniejszy materiał służy jedynie celom informacyjnym i nie stanowi oferty, w tym oferty w rozumieniu art. 66 oraz zaproszenia do zawarcia umowy w rozumieniu art. 71 ustawy z dnia 23 kwietnia 1964 r. – Kodeks cywilny (t.j. Dz. U. z 2020 r. poz. 1740, 2320), ani oferty publicznej w rozumieniu art. 3 ustawy z dnia 29 lipca 2005 r. o ofercie publicznej i warunkach wprowadzania instrumentów finansowych do zorganizowanego systemu obrotu oraz o spółkach publicznych (t.j. Dz. U. z 2022 r. poz. 2554, z 2023 r. poz. 825, 1723) czy też oferty publicznej w rozumieniu art 2 lit d) Rozporządzenia Parlamentu Europejskiego i Rady (UE) 2017/1129 z dnia 14 czerwca 2017 r. w sprawie prospektu, który ma być publikowany w związku z ofertą publiczną papierów wartościowych lub dopuszczeniem ich do obrotu na rynku regulowanym oraz uchylenia dyrektywy 2003/71/WE (Dz. Urz. UE L 168 z 30.06.2017, str. 12); Niniejszy materiał nie stanowi także rekomendacji, zaproszenia, ani usług doradztwa. prawnego, podatkowego, finansowego lub inwestycyjnego, związanego z inwestowaniem w jakiekolwiek papiery wartościowe. Materiał ten nie może stanowić podstawy do podjęcia decyzji o dokonaniu jakiejkolwiek inwestycji w papiery wartościowe czy instrumenty finansowe. Informacje zamieszczone w materiale nie stanowią rekomendacji w rozumieniu przepisów Rozporządzenia Parlamentu Europejskiego i Rady (UE) NR 596/2014 z dnia 16 kwietnia 2014 r. w sprawie nadużyć na rynku (rozporządzenie w sprawie nadużyć na rynku) oraz uchylające dyrektywę 2003/6/ WE Parlamentu Europejskiego i Rady i dyrektywy Komisji 2003/124/WE, 2003/125/WE i 2004/72/ WE. (Dz. U UE L 173/1 z dnia 12.06.20114). IX ASSET MANAGEMENT S.A., nie ponosi odpowiedzialności za prawdziwość, rzetelność i kompletność oraz aktualność danych i informacji zamieszczonych w niniejszej prezentacji. IX ASSET MANAGEMENT S.A. nie ponosi również jakiejkolwiek odpowiedzialności za szkody wynikające z wykorzystania niniejszego materiału, informacji i danych w nim zawartych. Zawartość materiału została przygotowana na podstawie opracowań sporządzonych zgodnie z najlepszą wiedzą IX ASSET MANAGEMENT S.A. oraz przy wykorzystaniu informacji i danych publicznie dostępnych, chyba, że wyraźnie wskazano inne źródło pochodzenia danych.